
One often overlooked feature of Excel is the What-If Analysis tool that allows you to explore different scenarios without changing the values in your spreadsheet. This function is particularly useful for economics and management majors as well as business owners because you can see how different values affect models, formulas, and projected profits.
Excel’s What-If Analysis Tool
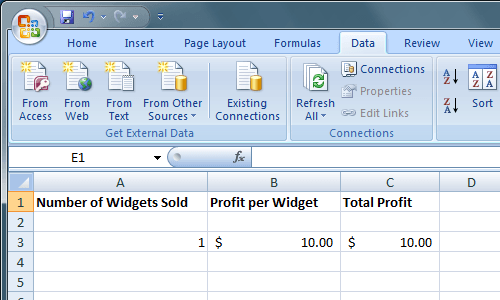
Suppose you own a small business selling widgets and you have determined that you will make a $10 profit for each widget you sell. To figure your profit from selling these widgets, you create a worksheet in Excel that looks like this:
Notice that the figure in cell A3 represents the number of widgets sold and the figure in B3 represents the profit per widget sold. The figure in C3 was calculated with the following formula:
=A3*B3
and represents the profit from selling 1 widget at a $10 profit.
However, you may be interested in your total profit at different numbers of widgets sold. Suppose, for example, you want to know what your profit would be if you sold 100, 200, or 300 widgets.
One way to do this is to change the figure in A3 for each of the scenarios we identified above. In other words, you could change A3 to 100 and note the change in profit in C3. You could then do the same for 200 and 300. However, Excel’s What-If Analysis function was designed for just such an occasion.
To use Excel’s What-If Analysis tool, begin by clicking on the Data tab on the Ribbon and locating the What-If Analysis tool button under the Data Tools section. Click on the What-If Analysis button and choose Scenario Manager from the list of options.

You should now be looking at the Scenario Manager window. Click on the Add button and Excel asks you to name the first scenario. You can choose any name you want but it would be prudent to choose one that is descriptive of the scenario you are creating. For our example here, name the scenario 100 Widgets.
In the Changing Cells box, type in A3 and then click the OK button.

In the Scenarios Values window that opens, type in 100 and click the OK button. Essentially what you have done is created a new what-if scenario that will calculate the total profit if the number of widgets sold in A3 were 100.

Complete the steps above to create two more scenarios, one for 200 widgets and one for 300 widgets. When done, the Scenario Manager window should look like this:

Click on the scenario labeled 100 Widgets and then click the Show button. Notice that cell A3 changes to 100 and cell C3 changes to $1,000. Now, click on the scenario labeled 200 Widgets and then click the Show button. Notice that cell A3 changes to 200 and cell C3 changes to $2,000. Do the same for the scenario labeled 300 Widgets.
The What-If Scenario also lets you see at one time a summary of all of the scenarios you created in the previous steps. Click on the Summary button and type C3 into the Results Cell box.

Click OK and Excel creates a new worksheet displaying all of your scenarios in one convenient summary.

Although simple, this example shows how powerful Excel’s What-If Analysis function can be. Using a worksheet filled with data and formulas, you can easily create useful What-If Analysis scenarios with Excel to save you the trouble of editing individual cells to see how these changes will affect the values in other cells. Enjoy!
