
“System (NT Kernel & System)” is pegging your CPU at 15–30% at idle in Task Manager, even when nothing demanding is running. The process itself isn’t the culprit. It’s almost always a buggy driver, an overactive background service, or a faulty hardware interrupt pushing work through the kernel.
What is the System (NT Kernel & System) process?
The System process (backed by ntoskrnl.exe, the Windows NT kernel) hosts kernel-mode drivers, hardware interrupt threads, and core OS functions. At idle, it should show near-zero CPU in Task Manager. When it spikes, the kernel is processing work triggered by something else, a driver, a background service, or a hardware interrupt, not malfunctioning on its own.
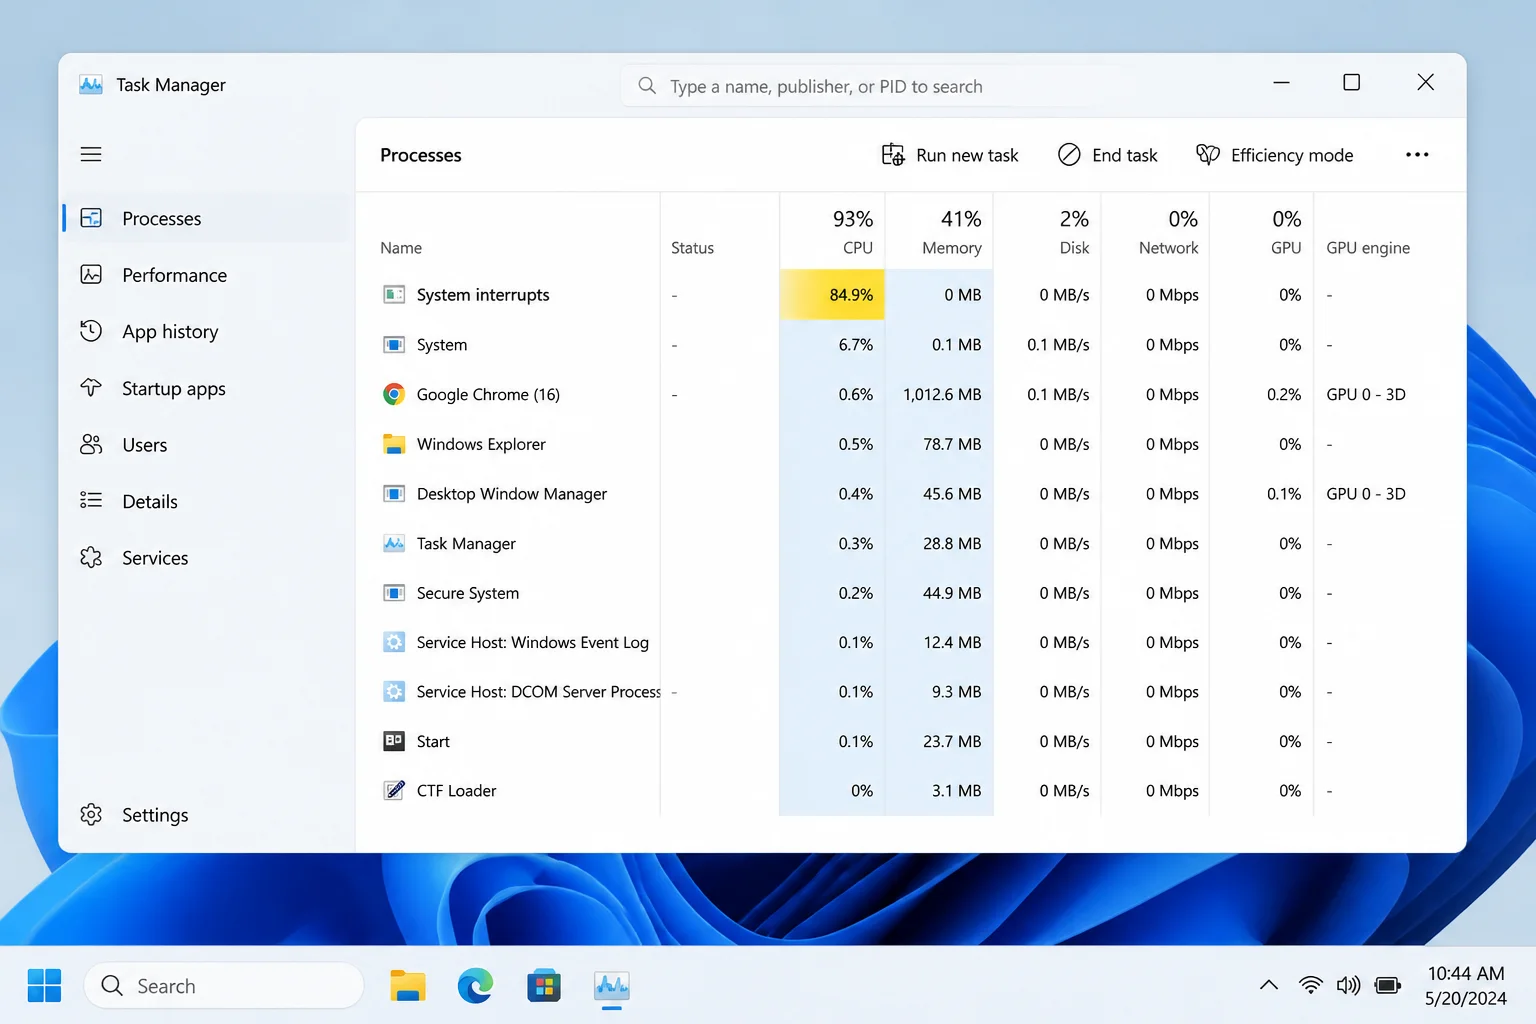
To confirm the spike is real: press Ctrl + Shift + Esc to open Task Manager, click More details if you see the compact view, then check the Processes tab for System and System interrupts. Sustained usage above 10% at idle warrants investigation. Don’t end the task or delete ntoskrnl.exe. It’s a core Windows component your PC cannot boot without. If you suspect malware is impersonating it, Fix #4 covers that.
Fix #1: Test in Safe Mode to narrow down the cause
Safe Mode starts Windows with only essential Microsoft drivers loaded. If System CPU drops to near zero there, a third-party driver or service is definitively to blame, which means Fix #2 or Fix #6 will likely solve it.
- Hold
Shiftand click Start > Power > Restart. - On the recovery screen, go to Troubleshoot > Advanced options > Startup Settings > Restart.
- Press
4for Safe Mode (or5for Safe Mode with Networking if you need internet access). - Once booted, press
Ctrl + Shift + Escand check System’s CPU on the Processes tab.
If System is near zero in Safe Mode, continue to Fix #2. If it’s still elevated in Safe Mode, go to Fix #3 to check for corrupted system files and Fix #4 to rule out malware.
Fix #2: Update your device drivers
Outdated or buggy drivers are the most common cause of high System CPU on Windows 10 and 11. GPU, network, and storage drivers are the usual suspects. In many documented cases, updating the GPU driver alone dropped System CPU from 30% to near zero. Windows Update typically lags behind OEM releases, so go straight to the manufacturer’s site.
- Press
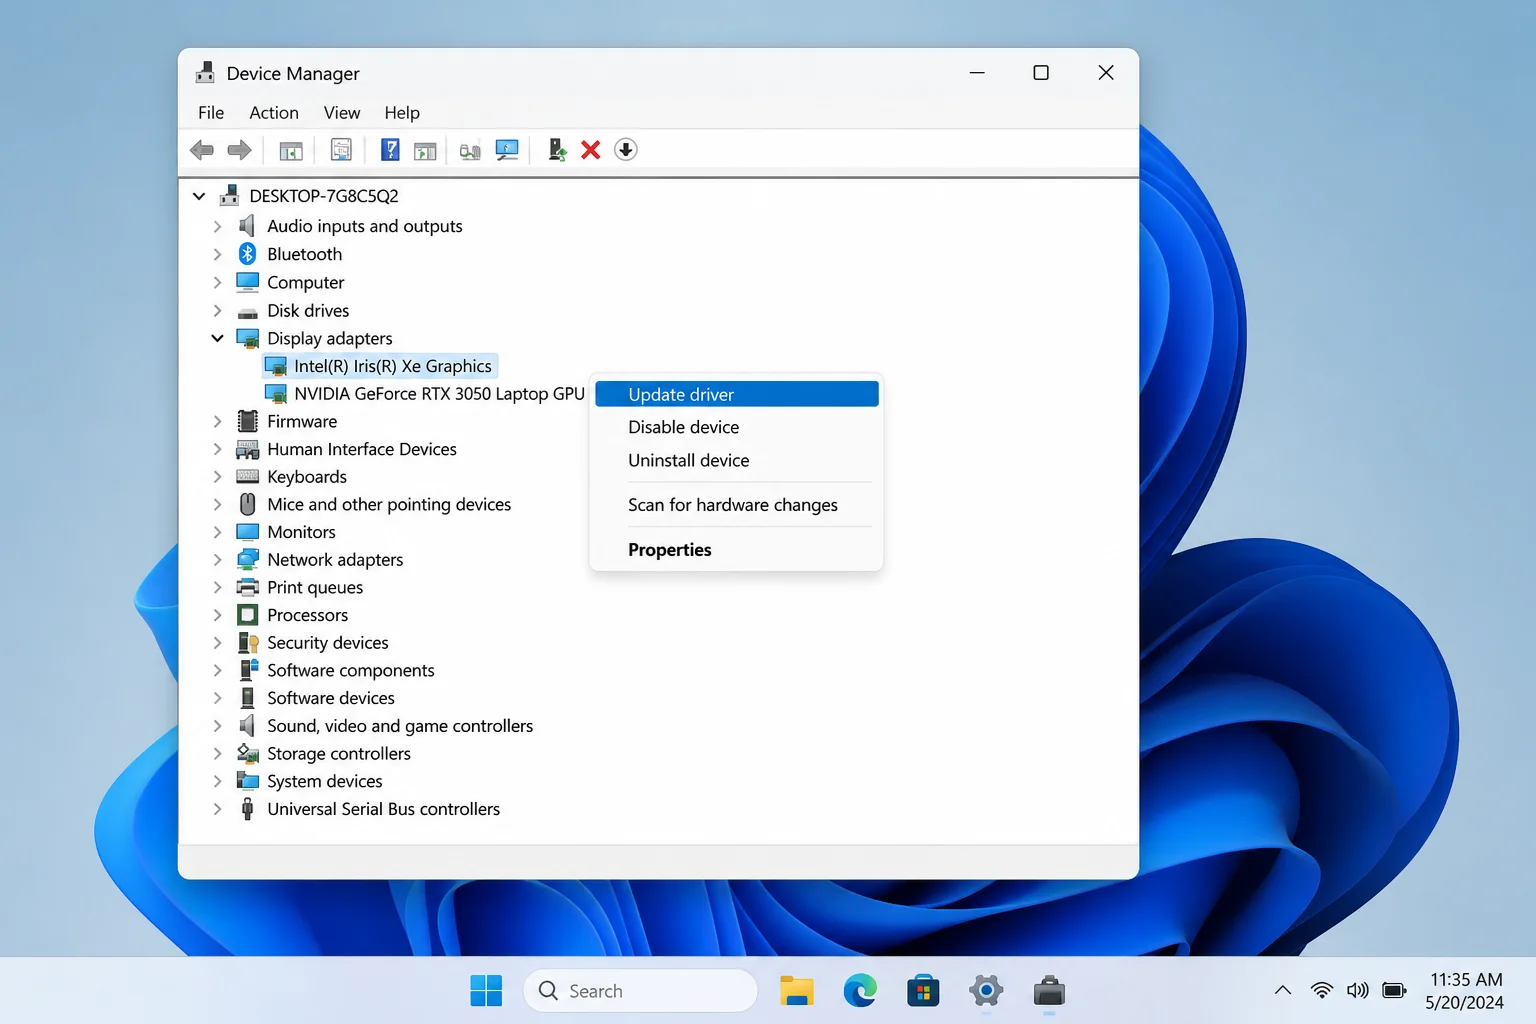
Win + Xand select Device Manager. - Expand and update drivers in this order, checking Task Manager after restarting each time:
- Display adapters (NVIDIA, AMD, or Intel GPU)
- Network adapters (Ethernet and Wi-Fi)
- Storage controllers (SATA/AHCI, NVMe)
- System devices (chipset, Intel Management Engine)
- Right-click each device and select Update driver > Search automatically for drivers.
- For the most current versions, visit the manufacturer’s site directly (nvidia.com, amd.com, intel.com, realtek.com) and download their full driver package, as these are typically newer than what Windows Update provides.
- Restart after updating each driver family and monitor System’s CPU in Task Manager.
If a recent driver update triggered the spike, right-click the device in Device Manager, open Properties > Driver, and click Roll Back Driver.
Fix #3: Run SFC and DISM to repair system files
Corrupted Windows system files can cause abnormal kernel activity. System File Checker (SFC) scans for and repairs corruption; DISM fixes the underlying Windows image itself if SFC can’t finish the job on its own.
- Click Start, type
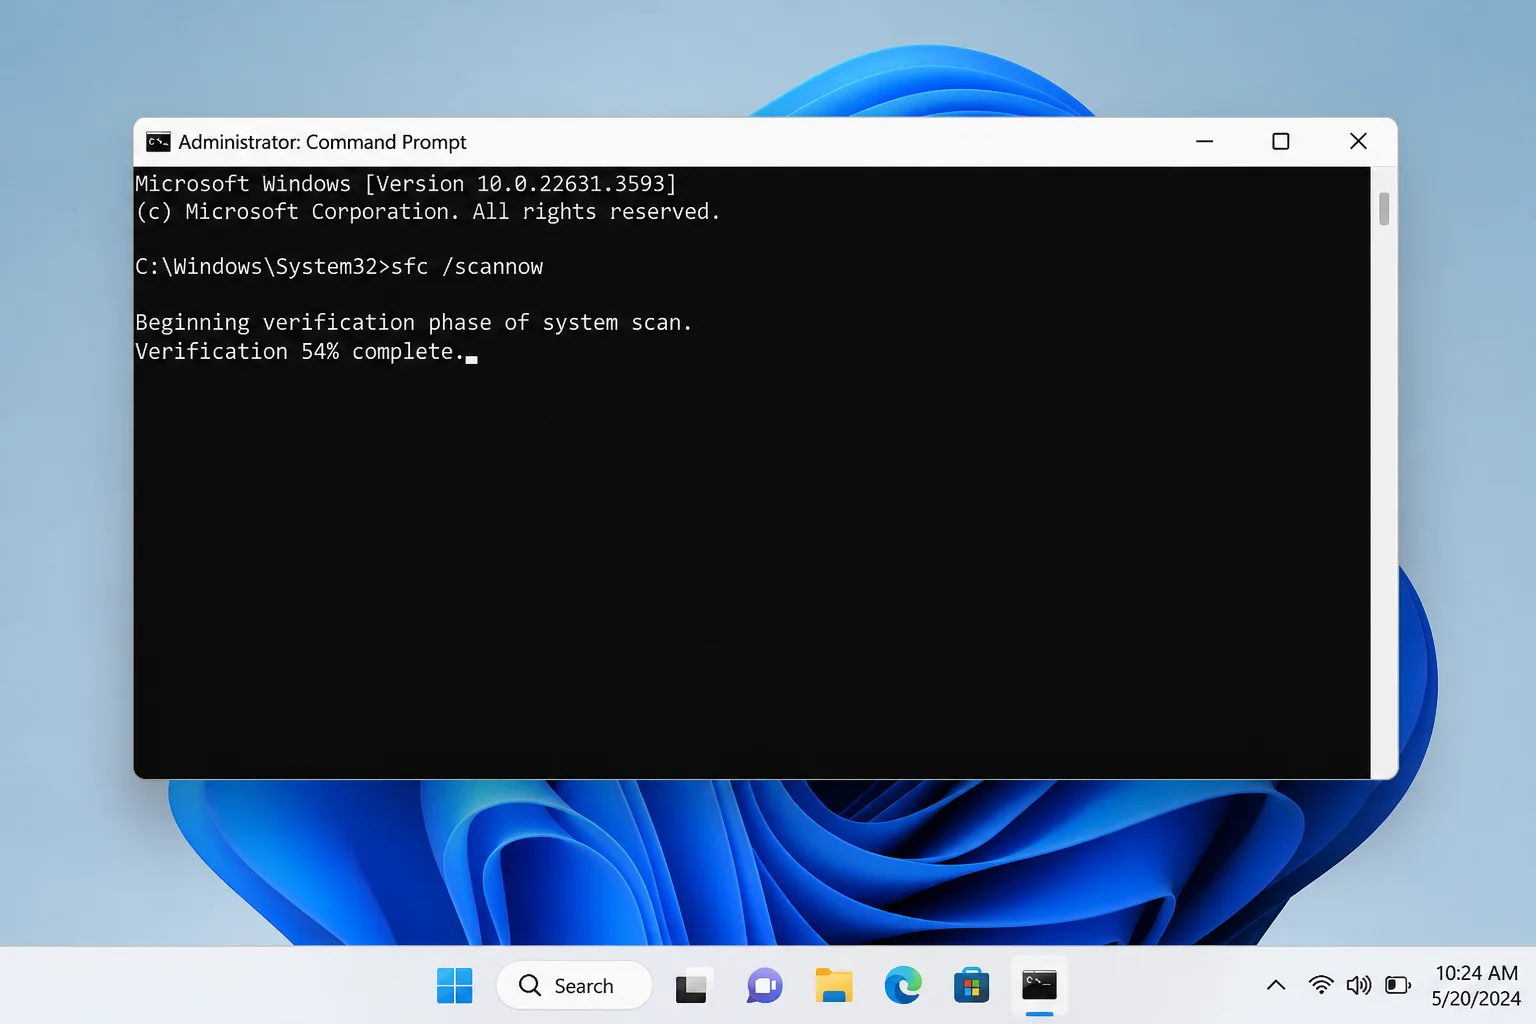
cmd, right-click Command Prompt, and select Run as administrator. - Run the following and wait for it to finish (10–15 minutes):
sfc /scannow
- When SFC completes, run this second command (requires an internet connection; takes 20–30 minutes):
DISM /Online /Cleanup-Image /RestoreHealth - Restart when both commands finish, then recheck System’s CPU in Task Manager.
Fix #4: Scan for malware
Some malware runs at the kernel level and registers as elevated System CPU. The genuine ntoskrnl.exe is a core Windows file that should never be removed, but malware can impersonate it or install kernel-mode filter drivers that drive the System process hard, so a full scan is worth running before going further.
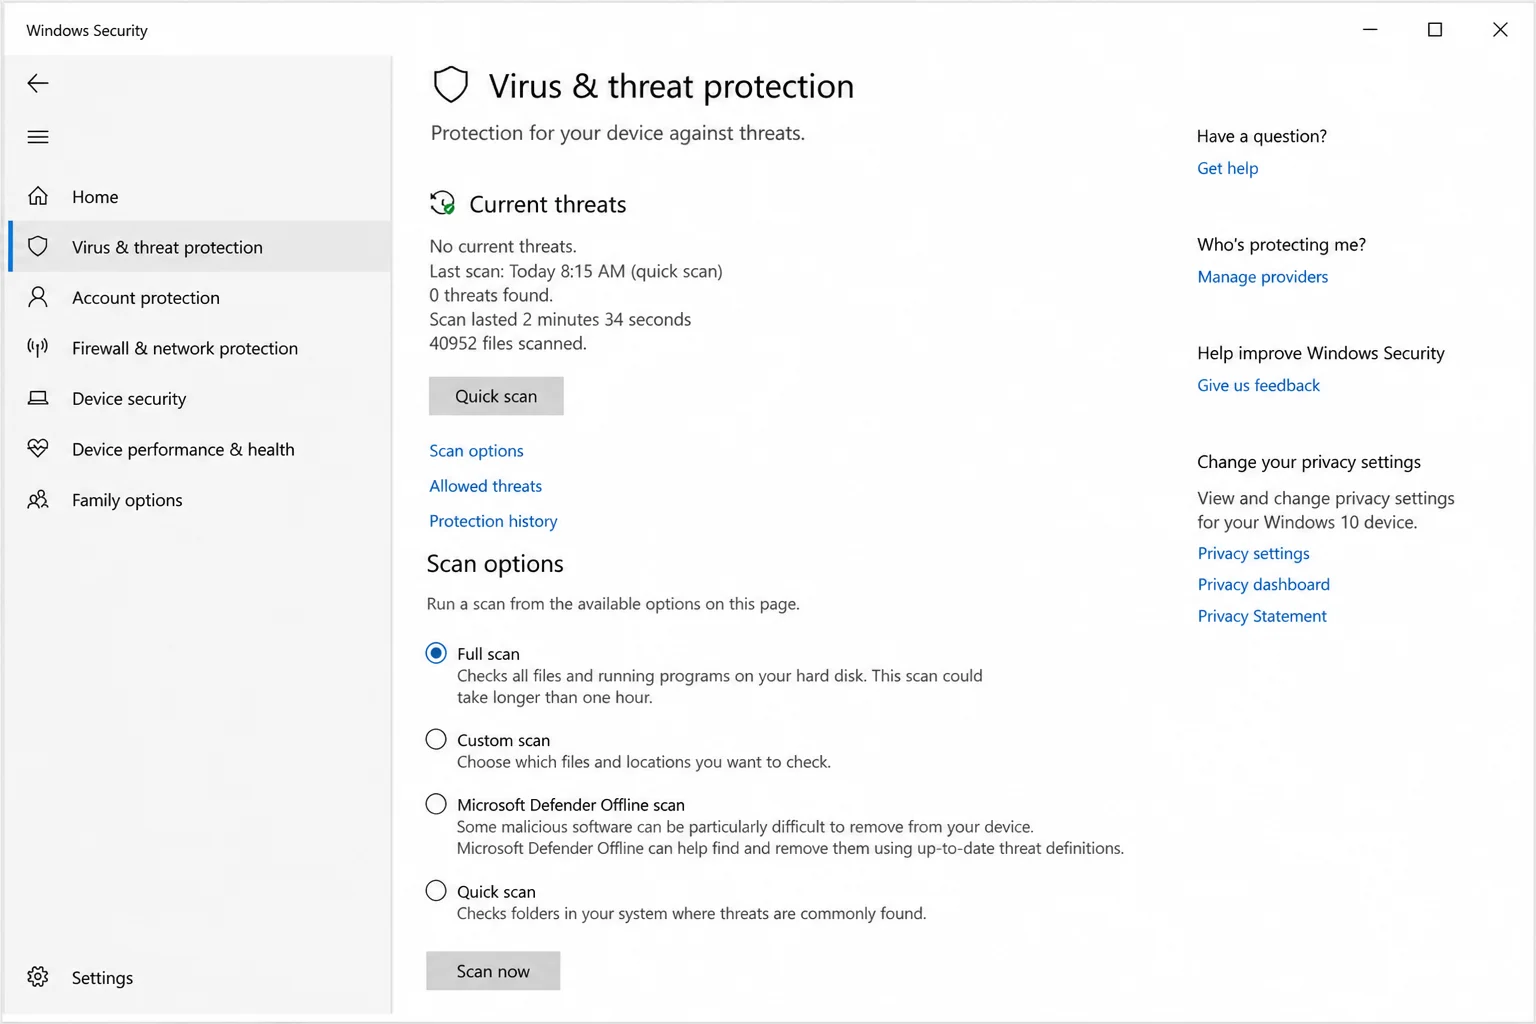
- Click Start and open Windows Security.
- Go to Virus & threat protection > Scan options.
- Select Full scan and click Scan now.
- For a second opinion, download the free version of Malwarebytes from malwarebytes.com and run a Threat Scan.
- Remove any detected threats, restart, and recheck System’s CPU.
Fix #5: Disable SysMain, Windows Search, and Delivery Optimization
Three built-in Windows services can drive persistent disk and CPU activity that surfaces in the System process. Disabling them temporarily tells you quickly whether any are contributing, and they’re all reversible.
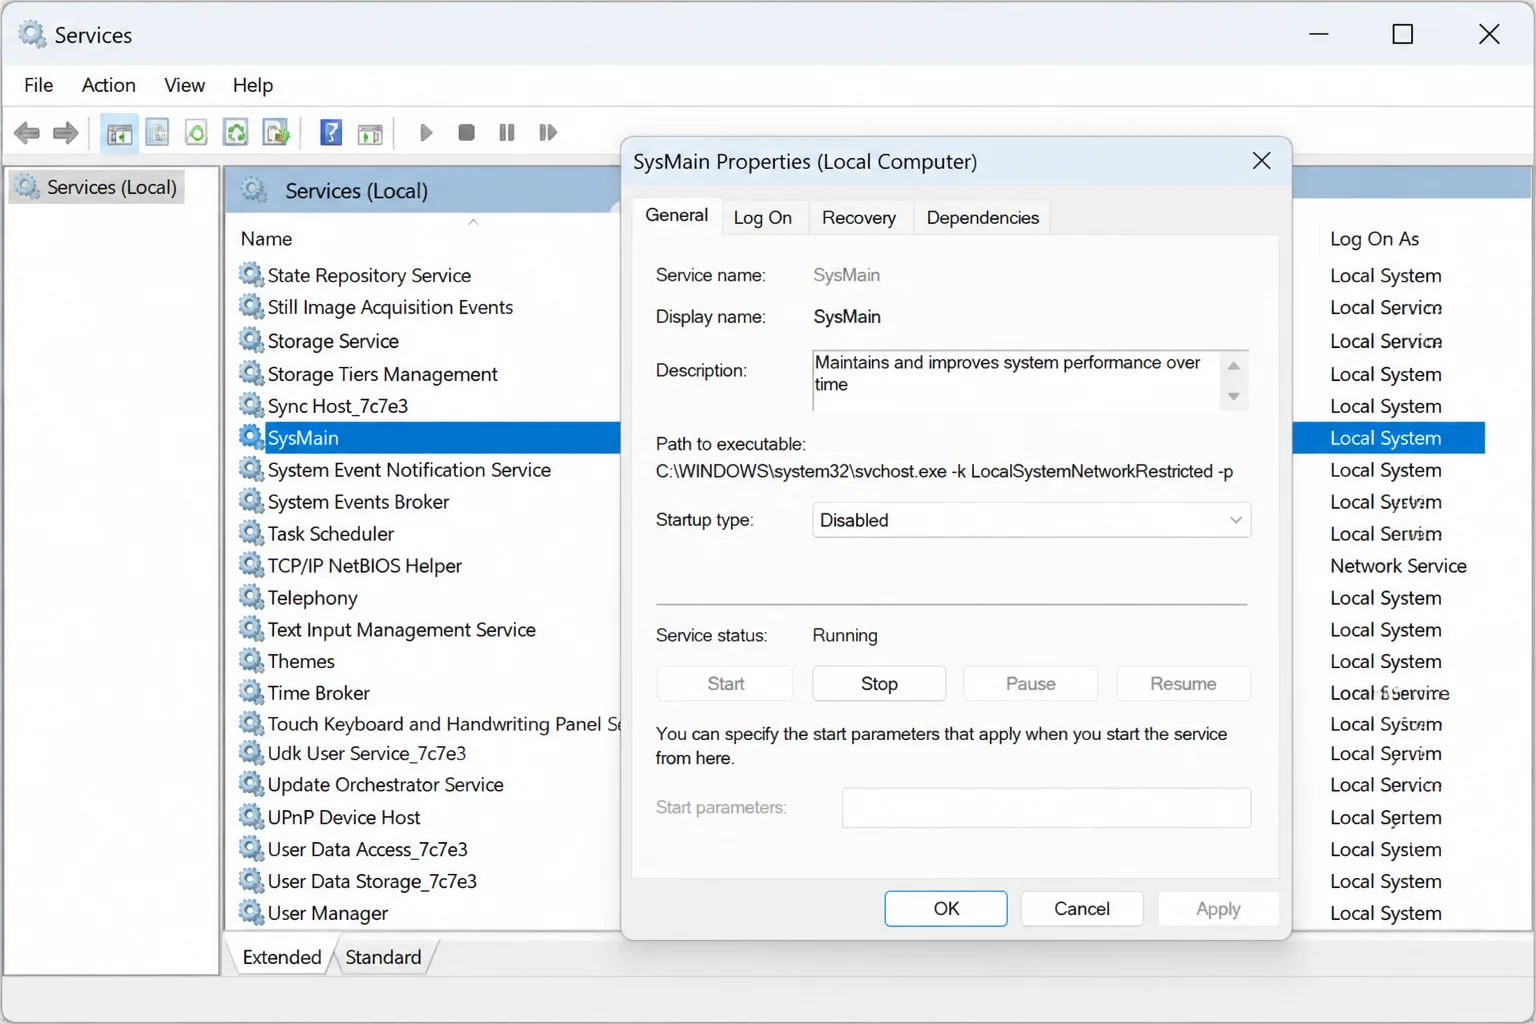
Disable SysMain (Superfetch):
- Press
Win + R, typeservices.msc, and press Enter. - Scroll to SysMain and double-click it.
- Set Startup type to Disabled, click Stop, then OK.
Disable Windows Search:
- In the same Services window, find Windows Search and double-click it.
- Set Startup type to Manual, click Stop, then OK.
Turn off Delivery Optimization:
- Open Settings and go to Windows Update > Advanced options > Delivery Optimization.
- Turn off Allow downloads from other PCs.
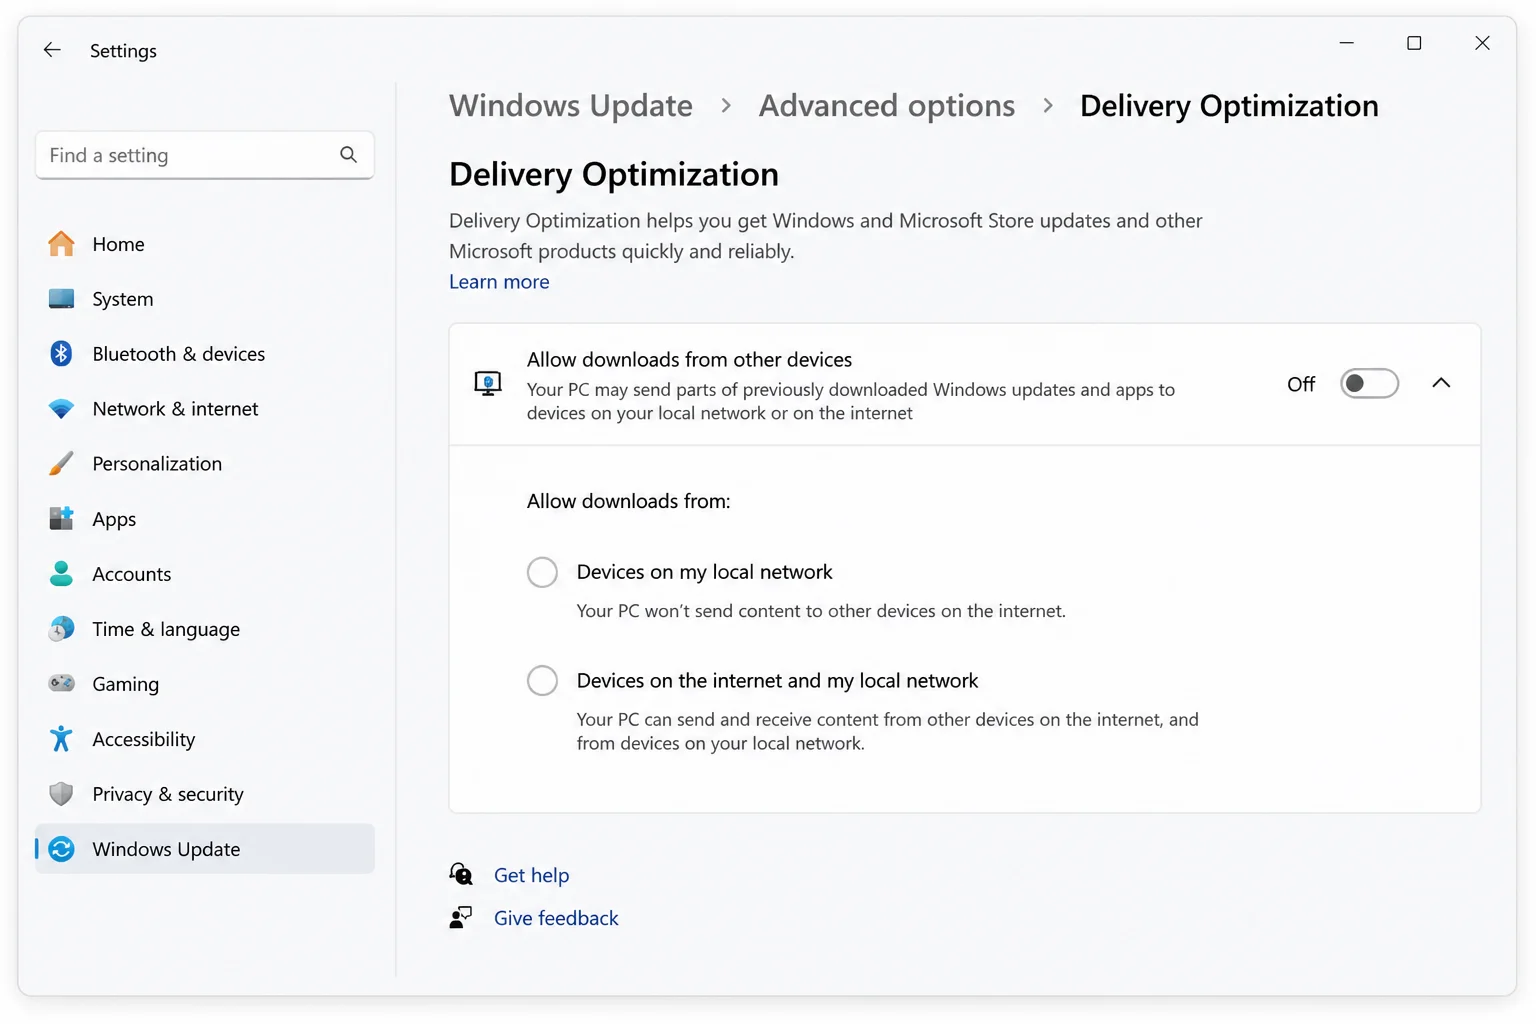
Restart and watch System’s CPU in Task Manager. If it drops after disabling one of these, you’ve found a contributor. Leaving SysMain and Windows Search off long-term is generally safe, though background search indexing will no longer run.
Fix #6: Clean boot to isolate third-party software
A clean boot starts Windows with only Microsoft services active, which rules out third-party software entirely. Cloud backup clients (Backblaze, Dropbox, OneDrive heavy sync), RGB lighting utilities, and antivirus real-time scan engines are surprisingly common causes of elevated kernel CPU.
- Press
Win + R, typemsconfig, and press Enter. - On the Services tab, check Hide all Microsoft services, then click Disable all.
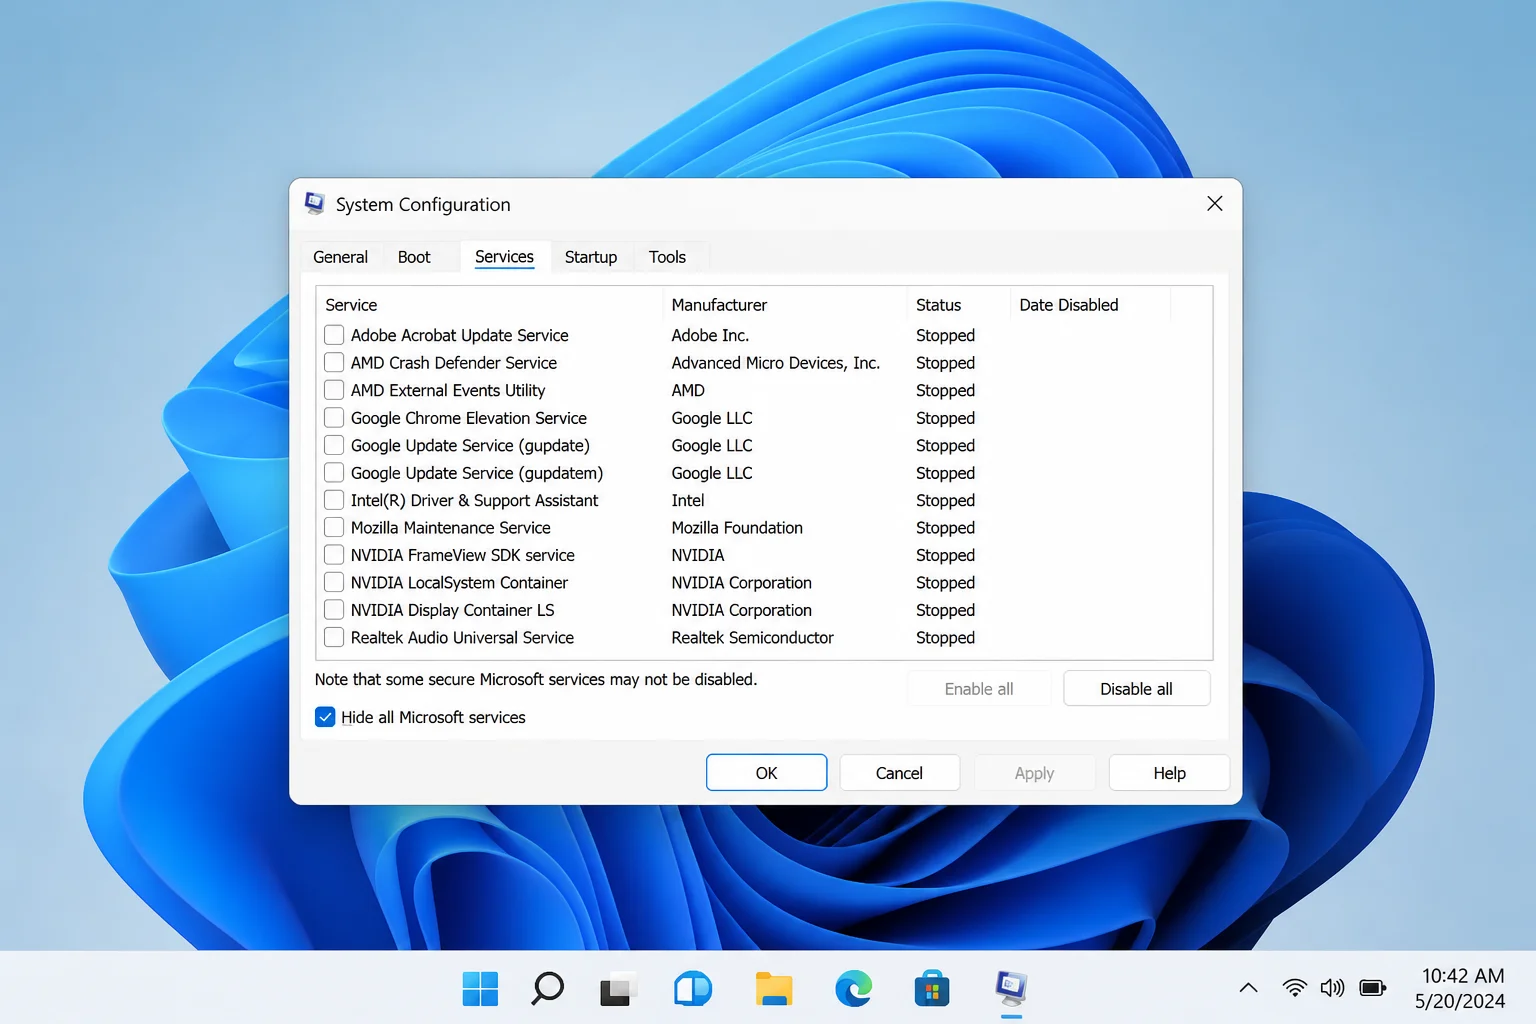
- Click the Startup tab, then click Open Task Manager.
- In Task Manager’s Startup apps tab, right-click each item and select Disable.
- Close Task Manager, click OK in System Configuration, and restart.
- Check System’s CPU after the clean boot.
If CPU is normal, re-enable services and startup apps in small batches, restarting after each, until the spike returns. The last batch you enabled contains the culprit. Then re-enable items in that batch one at a time to find the exact app or service.
Fix #7: Set PCI Express Link State Power Management to Off
A Windows power setting for PCIe devices can trigger repeated hardware interrupts on certain systems, which shows up as elevated System CPU. This is worth trying on laptops or desktops with dedicated GPUs or multiple PCIe cards.
- Click Start, type
power plan, and select Edit power plan for your active plan. - Click Change advanced power settings.
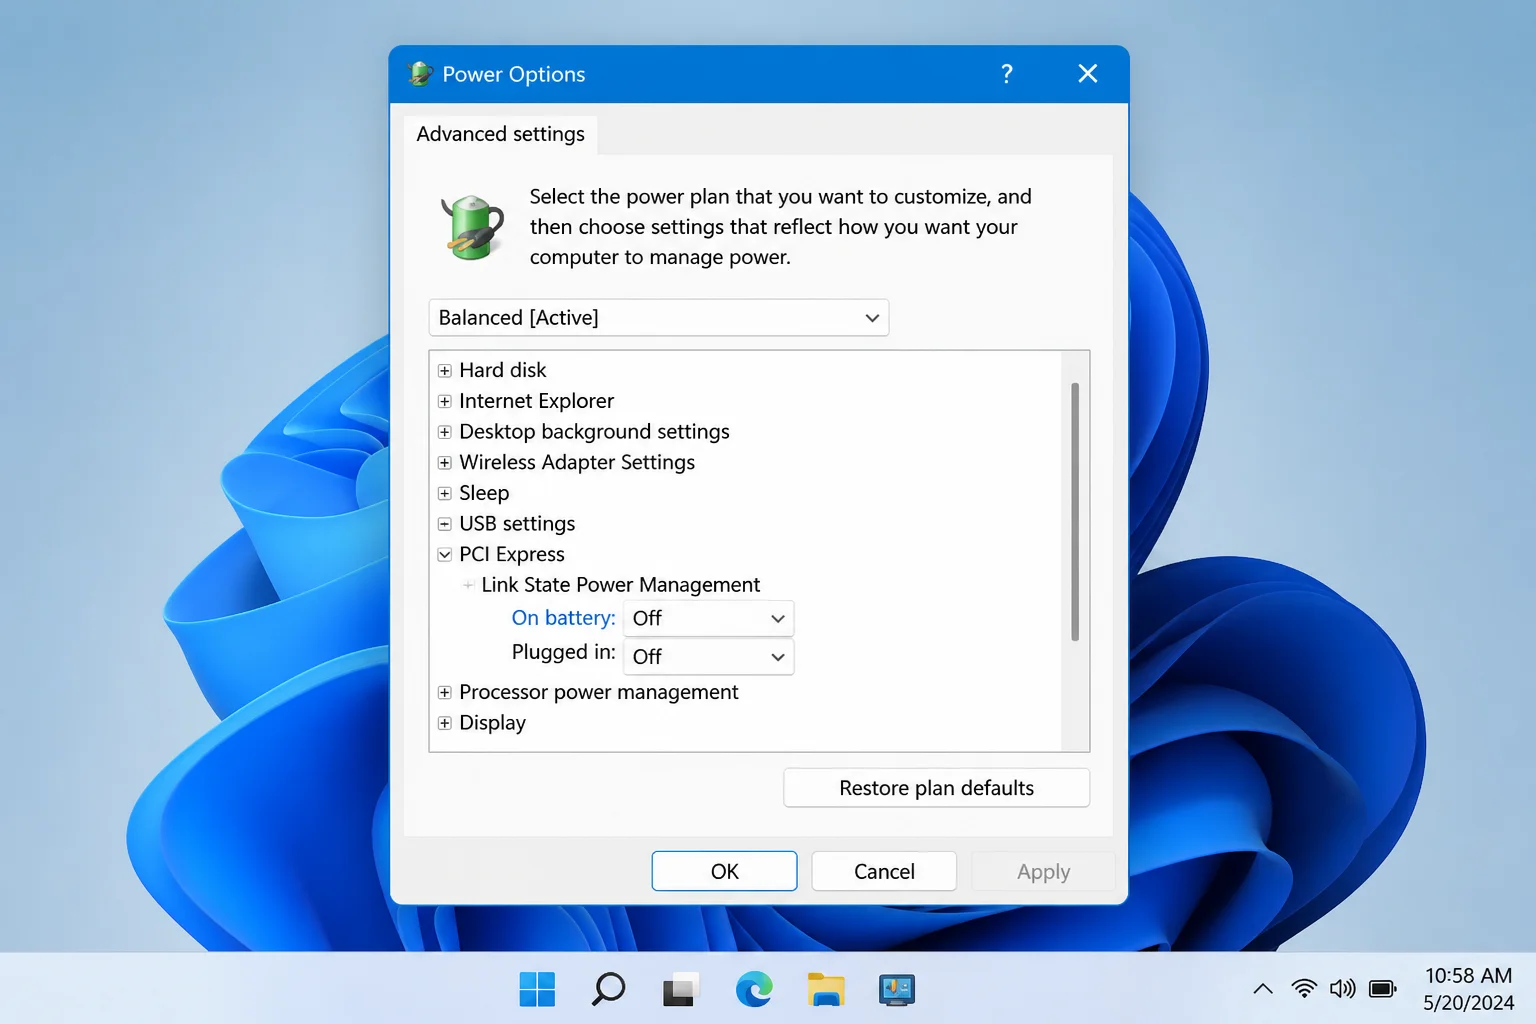
- Expand PCI Express, then Link State Power Management.
- Set both On battery and Plugged in to Off.
- Click Apply, then OK, and restart.
Fix #8: Identify the exact offending driver with Process Explorer
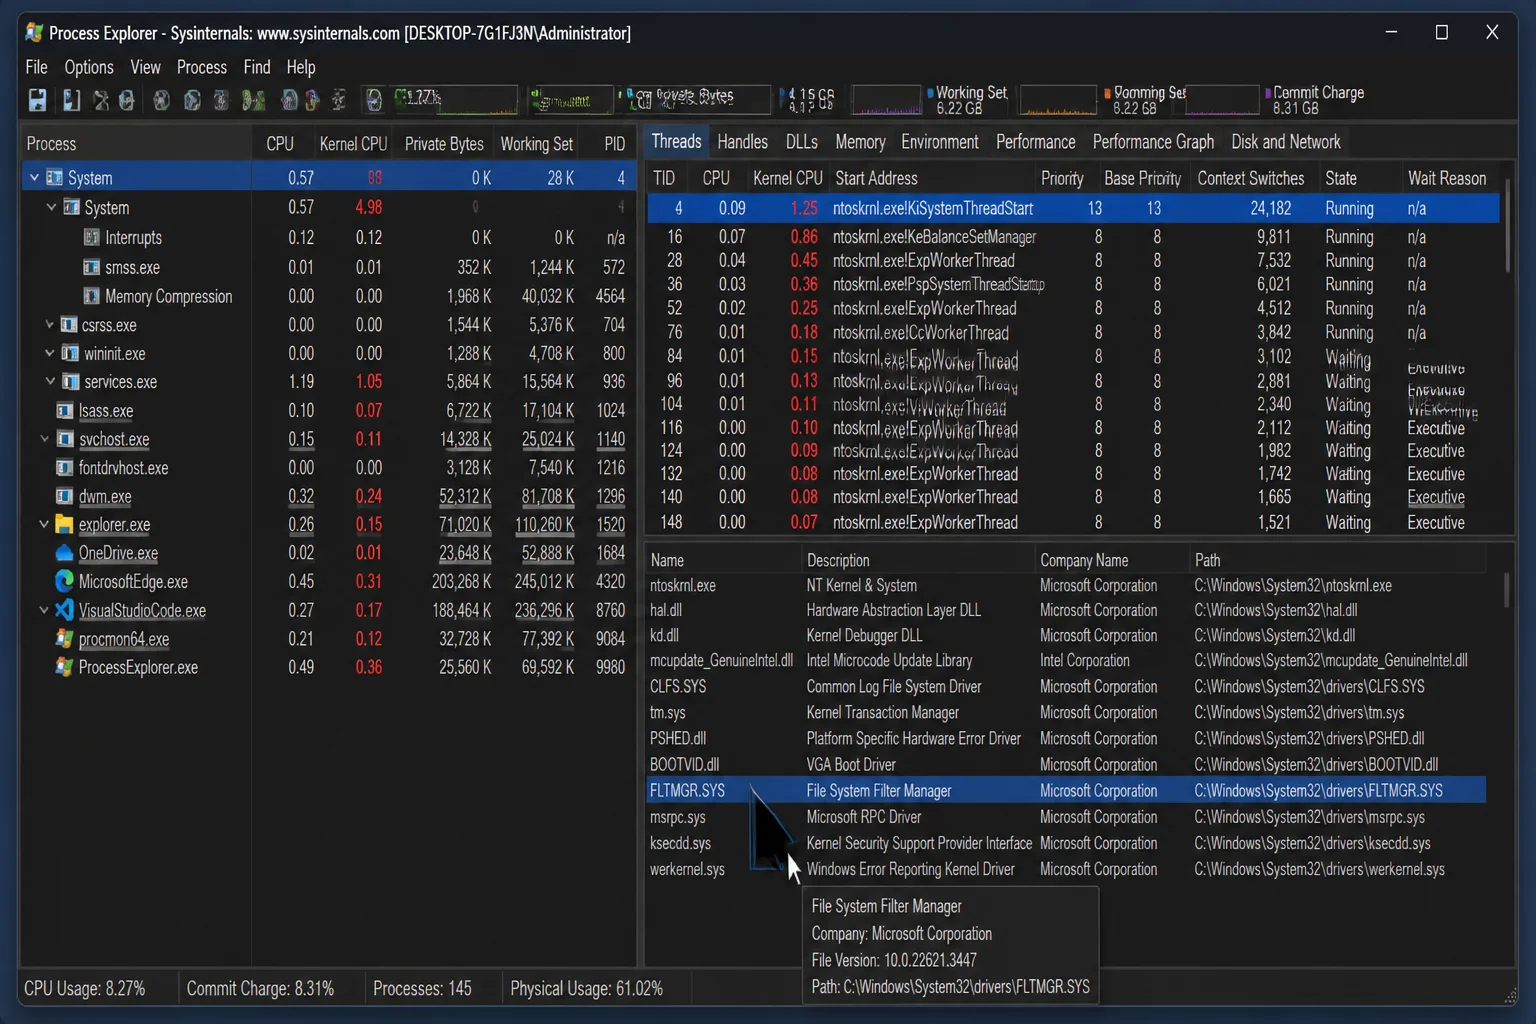
If none of the above fixes have pinpointed the cause, Process Explorer (free from Microsoft Sysinternals) shows you which specific kernel thread is hot and which driver module it belongs to, so you’re targeting one driver to update or remove rather than guessing.
- Download Process Explorer from learn.microsoft.com/en-us/sysinternals/downloads/process-explorer and run it as administrator.
- Go to View > Show Kernel Times. Kernel-mode CPU time appears in red in the CPU column.
- Find the System process in the list and expand it to reveal its threads.
- Look for threads with the highest red values. Hover over a thread to see its start address, which identifies the driver module responsible (e.g.,
nvlddmkm.sysfor NVIDIA graphics,e1d68x64.sysfor Intel Ethernet,ndis.sysfor a generic network stack issue).
- Search the
.sysfilename in Device Manager to identify the associated hardware, then update, roll back, or uninstall that specific driver.
If the hot thread points deep into ntoskrnl.exe with no clear driver module attached, the issue is likely a DPC (Deferred Procedure Call) from a hardware interrupt. The table below shows the best diagnostic tools to use from that point:
| Tool | Best for | Where to find |
|---|---|---|
| Resource Monitor | Correlating active services and file handles with CPU usage | Built into Windows; search resmon |
| Process Explorer | Identifying hot kernel threads and their driver modules | Microsoft Sysinternals (free) |
| Windows Performance Recorder (WPR) | Capturing a kernel-level trace of DPC/ISR activity | Windows ADK (free download) |
| Windows Performance Analyzer (WPA) | Viewing the WPR trace to pinpoint the exact driver module causing DPC load | Installed with Windows ADK |
WPR and WPA are the same toolset Microsoft support uses internally for kernel-level CPU diagnosis. If you’re still stuck after Process Explorer, they’re your best option for a definitive answer.
When the fixes don’t work
If System CPU stays elevated after all eight fixes, consider hardware fault as a possibility: a failing NVMe drive, a defective network card, or a USB controller with buggy firmware can all cause persistent DPC interrupts. Run your storage manufacturer’s diagnostic tool (Samsung Magician for Samsung SSDs, or CrystalDiskInfo for any drive) to check for underlying errors. If the problem appeared right after a specific hardware addition or a Windows feature update, that’s your most productive lead for further investigation with Microsoft support.
Conclusion
Fix #2, updating drivers, especially the GPU, is a solid bet and resolves this for most people. If it comes back after a Windows Update, roll back the most recently changed driver first; OEM driver packages pushed through Windows Update occasionally reintroduce known-bad versions. Persistent high System interrupts alongside high System CPU points squarely at a DPC/IRQ problem, so go straight to Fix #8 and let Process Explorer identify the exact .sys file to target rather than working through a list of guesses.