There is a lot going under the hood of a Windows computer. Using the Event Viewer, it’s possible to track Windows processes, helping you diagnose pesky problems without an obvious cause.
The Event Viewer can be confusing to use, however, owing to its outdated UI and poor layout. Here is a guide on navigating the Event Viewer to troubleshoot any Windows issues.
Getting Started With the Event Viewer
The Windows Operating System “logs” every significant activity while it runs. The Event Viewer is just an app that helps you access and read these logs in one place, rather than manually opening each text file in Windows Explorer.
- Open Event Viewer by searching for the app in the Start Menu.
- Maximize the app as soon as it opens, because you need the full-screen view to see all the information available.
Understanding the Interface
Event Viewer doesn’t exactly have an intuitive interface. The tool can be a bit confusing at first, so let’s go over all the elements one by one.
Left Pane
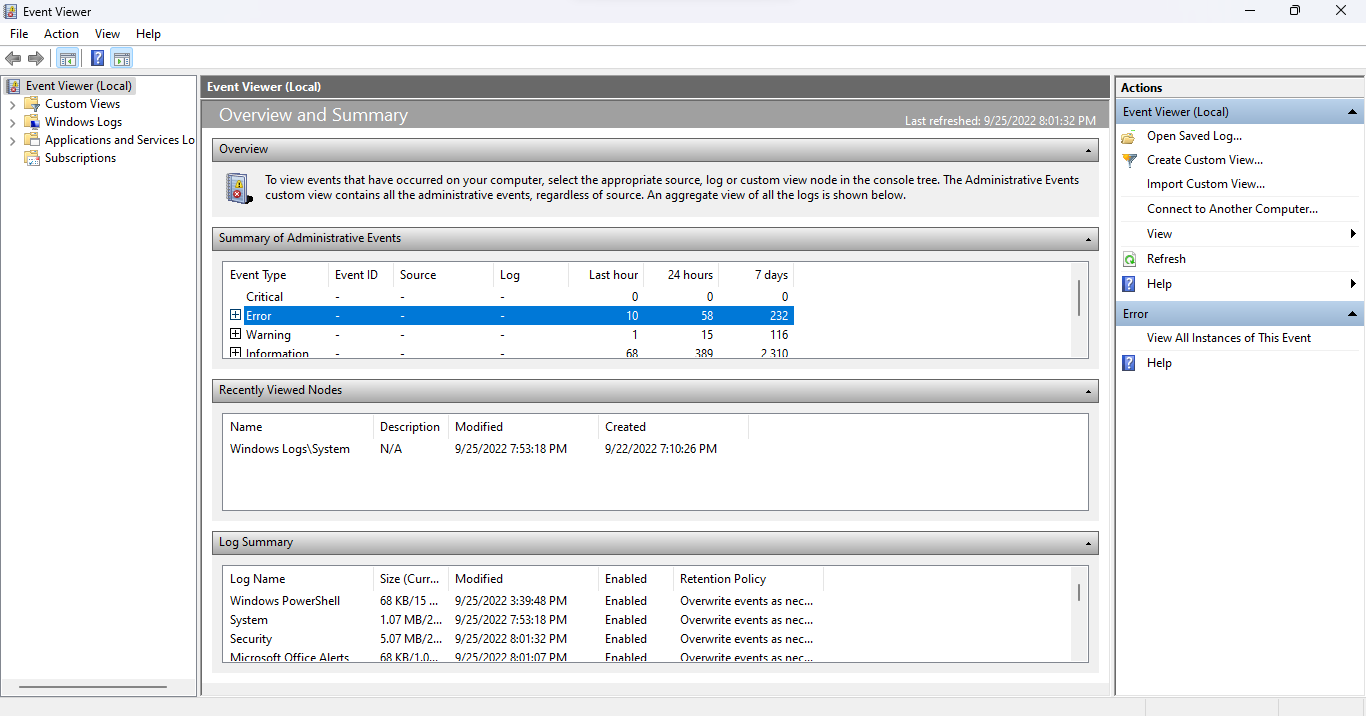
On running Event Viewer, you will notice that the window is divided into three panes. The left side categorizes the events in a folder view, letting you quickly navigate to a particular type of event logs.
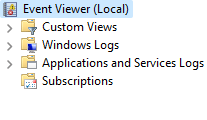
There are four main types of logs:
- Custom Views: The Custom views category, as the name suggests, lets you create custom log selections instead of sticking with the standard categories. For example, the default Administrative Events view collects the Critical, Error, and Warning events from all administrative logs.
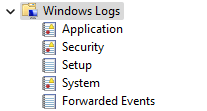
- Windows Logs: This folder includes all logs concerning Windows system services. It’s not particularly useful unless you want a detailed look at how the OS is operating.
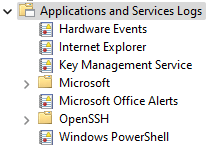
- Applications and Services Logs: These logs are generated by all kinds of services, from non-critical Windows services to third-party applications. You don’t need to trawl through this list as any errors and warnings are already collected in the Administrative Events view.
- Subscriptions: This category is not available by default, and is unnecessary in most cases. Its only use is to collect events from remote computers, making it an advanced system administration tool.
Middle Pane
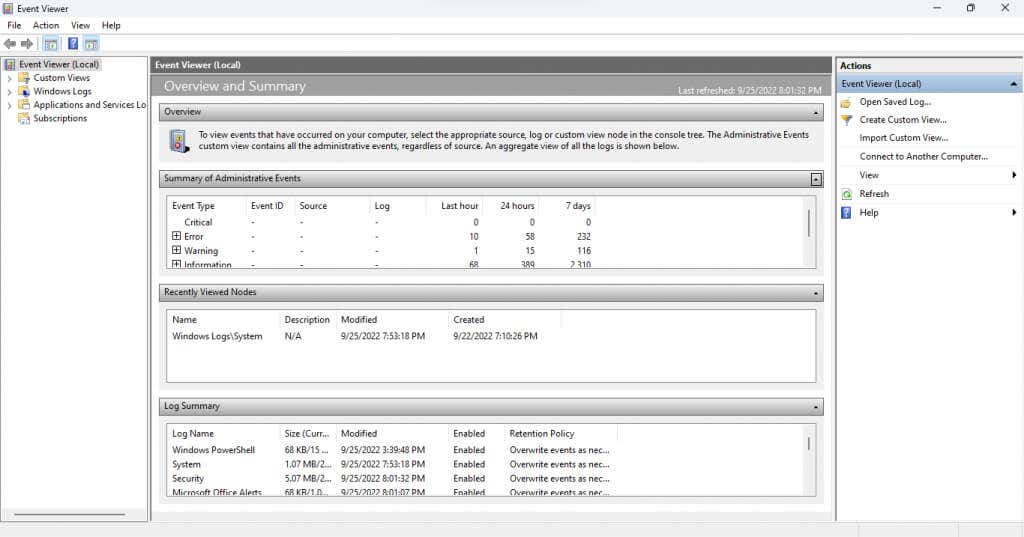
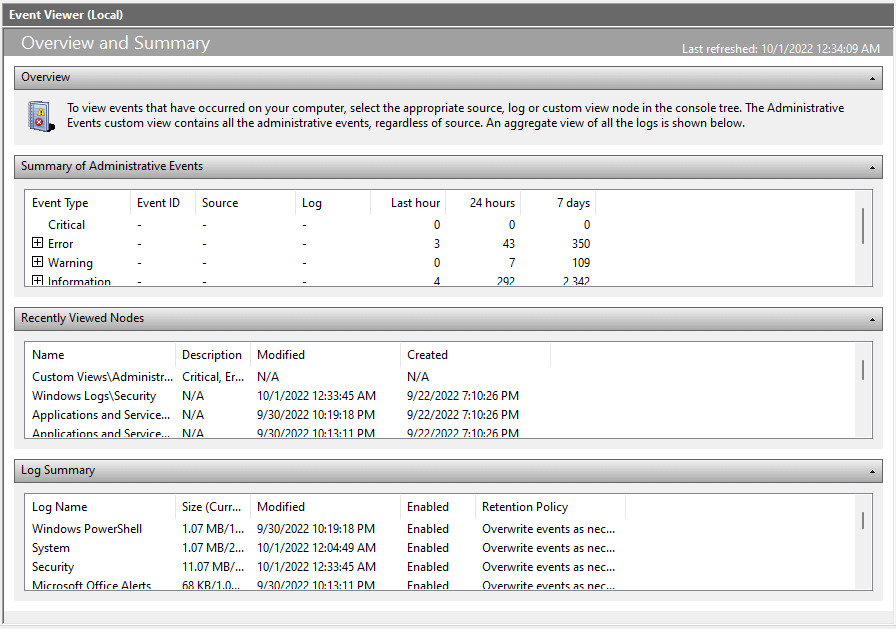
This is where the logs are actually listed. By default, it displays an Overview and Summary of events, rather than any specific category.
The first section (and probably the most important) is the Summary of Administrative Events. It lists crucial system events in the past week, giving you a quick glimpse of the system’s health. The events are also classified by their timeframes on an hourly, daily, and weekly basis.
There are five event types in this section:
- Critical: Any major system issues crop up in this category. In a properly functioning computer this category should be empty, but if you spot an event of this type, pay attention to it.
- Error: There are errors in any functional computer. Just because there are events listed in this category does not mean something is necessarily wrong. It is a problem only if the same error shows up frequently on a daily basis.
- Warning: Warnings are generated when something hasn’t really gone wrong yet, but might indicate a possible issue. This includes things like low disk space, or improperly configured drivers.
- Information: This one is completely harmless, as it notes all successful operations on the computer. The source is usually system services, though security applications often show up as well.
- Audit Success: This type of event is generated whenever an authentication attempt is successful. This includes logins and other security measures, so don’t be alarmed to find multiple instances in every timeframe.
- Audit Failure: As the name suggests, this event type includes failed authentication attempts. This is a good way to see if anyone has tried gaining access to your PC, either through a network connection or a direct login.
Right Pane
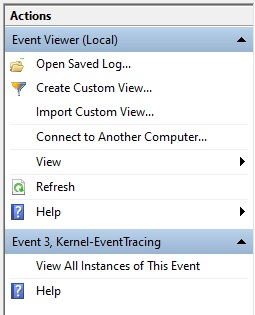
The right panel of the window contains all actions you can take for a selected item. The actions change based on whether you have a folder selected or an event.
You can Create a Custom View, view the Properties of a log, or Save Selected Events to view them later, among other actions.
How to Read Event Logs
Opening a view and going through the event logs is simple enough, but how do you make sense of all that information? Here’s a breakdown.
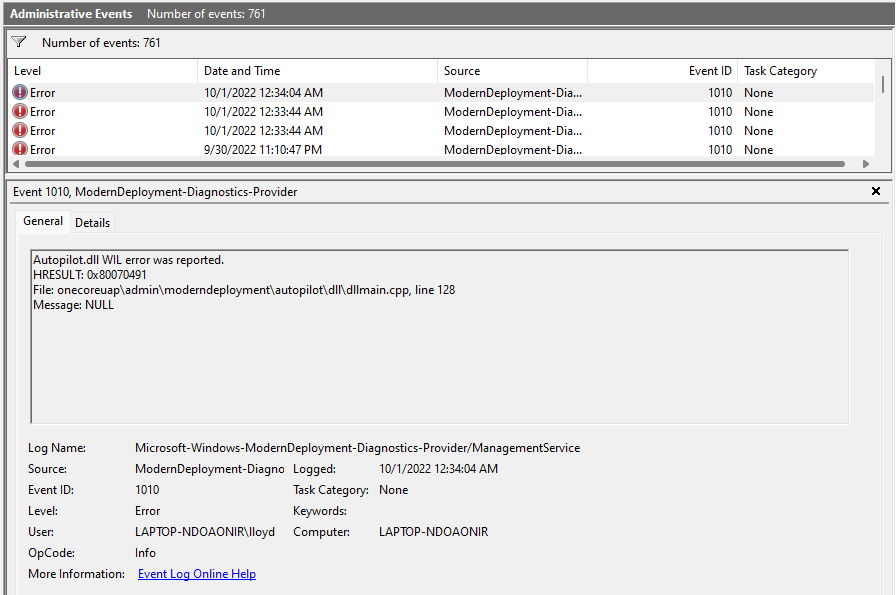
When you select an event, the General tab opens up, displaying a short summary of the error followed by a bunch of information fields:
- Log Name: The name of the log the event belongs to. Mostly useful to identify the Windows service under which the event occurred.
- Source: Usually the same as the log name, as it lists the source application of the event.
- Event ID: Each event has a unique event ID. This ID helps identify a specific event from other events of a similar nature, even when they are generated from the same process.
- Level: This is the tag that decides the priority level of the event. You have already seen tags like Error and Critical in the Administrative View, and this field is where they are taken from.
- User: The User account that generated the event. Useful in diagnosing problems in multi-user systems.
- OP Code: This field is supposed to identify the activity of the process in question before the event was triggered, but in practice almost always defaults to Info.
- Logged: The timestamp of the event, including the date as well.
- Task Category: Another field supposed to provide additional information about the originating process, though mostly left empty.
- Computer: The name of the PC that created the event. Useless when you are working with a single system, but crucial when dealing with events forwarded from a network computer.
That may seem like a lot of information to take in, but you don’t need to read through all the fields. The most important fields are Level and Source.
With Level, you can tell how serious the event is (with Critical events being most important) and Source informs you of the originating app or component. This lets you find and kill the problematic process.
How to Troubleshoot Windows Problems With the Event Viewer?
When you suffer a sudden system crash, your first stop should be the Event Viewer. Run the Administrative View and check for any Critical events.
As fatal system crashes always generate a critical event, this helps you quickly zero down on the errant process and start looking for a fix. Depending on the Windows component involved, the fix might be as simple as updating drivers or running SFC from the Command Prompt.
For smaller issues, you may have to go through the Error events as well. It helps if you know which app or feature is misbehaving, as even a healthy system generates some errors.
Related Posts
Levin Roy is a software engineer who loves writing about technology. Whether it is Windows tips-and-tricks or in-depth guides about application development, Levin uses his practical experience and technical skills to create articles that can help solve tricky problems. Read Levin’s Full Bio
