Diagnosing Windows is not only something IT analysts need to worry about. Anyone who owns a computer should be comfortable using Windows diagnostics tools to do basic troubleshooting.
Believe it or not, you can fix most problems yourself if you have the right tools available and know how to use them.

Diagnosing Windows problems doesn’t require complicated tools or advanced computer knowledge either. With the right tools, any computer owner should be able to narrow down issues they may be having.
The following are 15 of the most effective Windows diagnostics tools you can use to identify what may be ailing your Windows PC.
Process Explorer
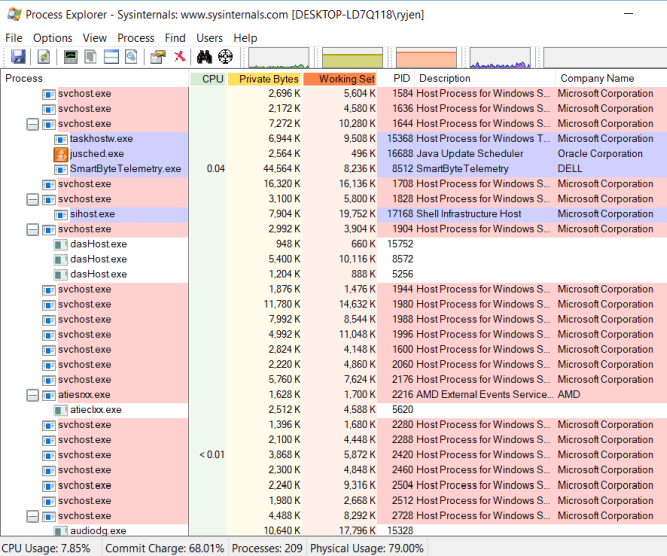
The first tool is one of those diagnostics apps you don’t realize you need until you’ve used it. Most computer experts will direct you to use the Processestab in Task Manager to see what applications may be consuming all your CPU time.
The problem with Task Manager is it only shows top level processes. On the other hand, Process Explorer uses a tree structure to show you not only top-level processes, but also child processes connected to that application.
This tool is a favorite among programmers looking to make sure their application processes don’t have memory leaks or CPU usage issues.
Process Explorer also includes all the following diagnostics features:
- Real-Time CPU, Memory, I/O, and GPU charts.
- Color coding to see most active processes.
- Get detailed properties about processes like memory, priority, handles, and more.
- Customize multiprocessor CPU load and process priority.
CPUID
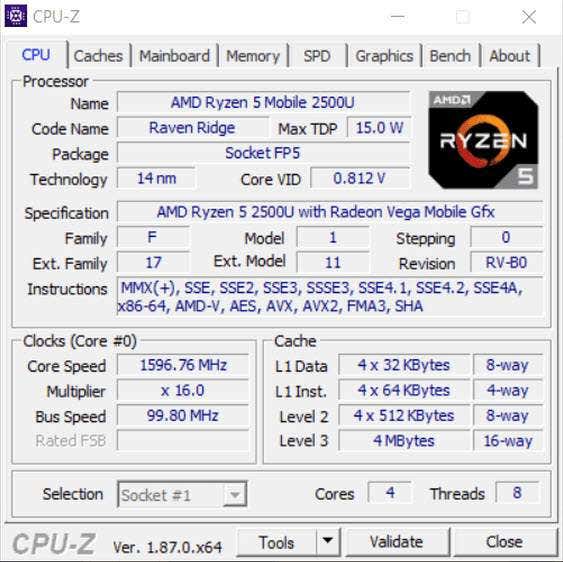
When you’re working with a remote help desk and need CPU information, CPUID is a powerful tool to view everything you need to know about your CPU. It can also help gather GPU or memory card information if you’re looking to upgrade your system and want to find a perfect match.
It’s free to download and use and works on both 32-bit and 64-bit systems. The amount of information it shows you about your CPU and other system information is impressive.
- Processor brand and all specifications
- Cache sizes
- Motherboard brand and version.
- Current memory size and timings
- Specs for memory cards in each slot
- GPU brand, clock speed and memory
- CPU benchmarking and stress testing tools
System Explorer
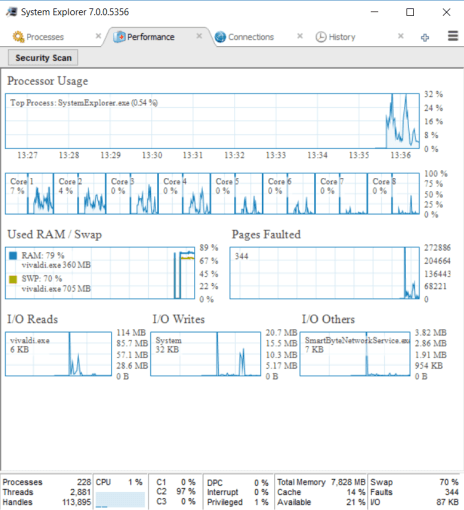
System Explorer is an impressive tool that gives you more insight into your overall system performance than most other available tools.
In addition to running processes, it includes real-time charting, all active internet connections, and a history of process activity.
Features in System Explorer include:
- Tree structure breakdown of all active processes
- Built-in tool to perform a file security check
on active processes - Double click a process to see what company create
it and all associated modules - Excellent system usage real-time charting of
CPU, RM, and I/O - All running processes using your computer’s
internet connection - Historical list of processor activities
Reliability Monitor
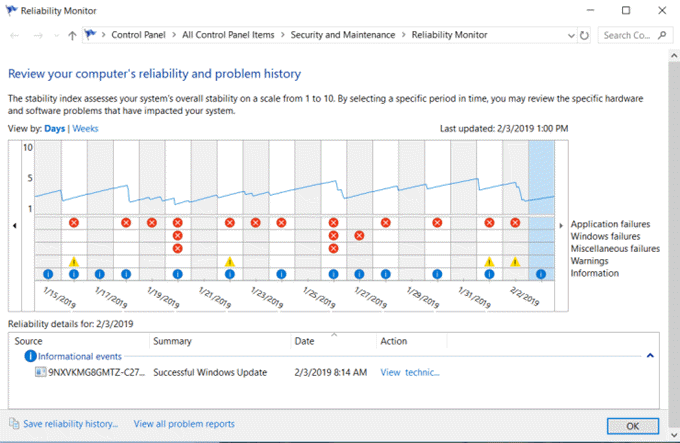
There is one useful diagnostics tool built right into Windows 10 that you can use without the need for an install. This is called the Reliability Monitor.
To open it, click Start and type reliability. Select View reliability history.
The reliability history graph shows you where any errors have occurred in your Windows system. These are the same errors you might see in the Windows Event Logs but laid out in a graphical way where errors are easy to spot.
How to use the Reliability Monitor:
- Click on any red X to see more information in
the bottom pane about those errors. - Click any yellow ! to see more information about
those warnings. - Use View
technical details to see more detailed information about warnings or
errors.
You don’t need to worry about all errors and warnings. Most Windows systems have random errors that occur. But if you see a recurring pattern of critical errors over a long period of time, you might have identified an issue that’s impacting your system performance.
Wi-Fi Analyzer
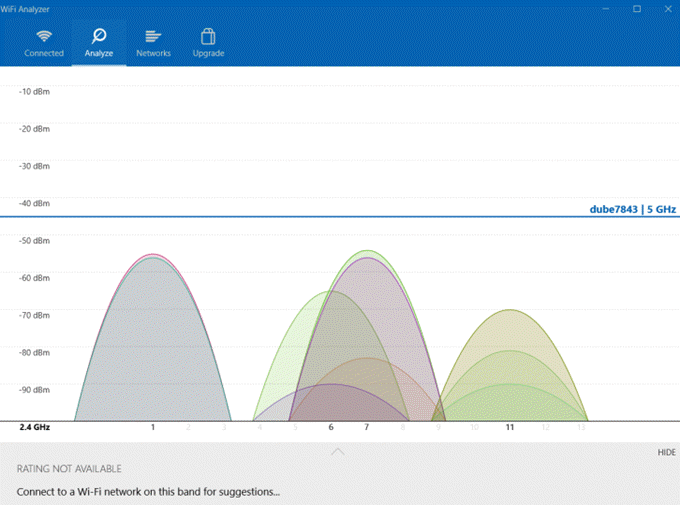
This is a free application you can install from the Microsoft Store. It’s a powerful tool for quickly analyzing all wireless networks where you are.
It provides the current strength of available Wi-Fi signals. It also shows you a breakdown of details for the network you’re currently connected to. These include the channel, frequency, bandwidth, and more.
Other features of the free version include:
- Realtime graph of all local Wi-Fi signals and
their strength - Filter Wi-Fi graphs based on wireless frequency
- Bar chart of the strength of all available
wireless networks - Link speed of your currently connected network
Angry IP Scanner
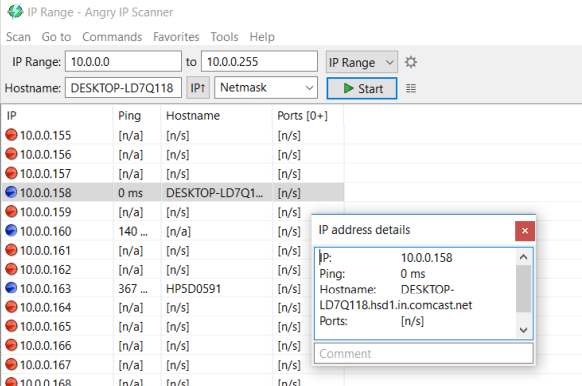
If you feel like the bandwidth of your current network seems slow, you can use a tool like Angry IP Scanner. This tool will scan your entire network and show you all devices connected to your network.
Actively connected devices show up as IP addresses with blue dots. You’ll also see the device hostname and current ping status.
Features of Angry IP Scanner include:
- Export the IP list to different file formats
- Works with third party data fetcher applications
- Includes a command-line tool you can use to scan
your network with a scheduled task - Available for Windows, Mac, and Linux systems
- Runs from an EXE file and doesn’t need to be
installed
WinDirStat
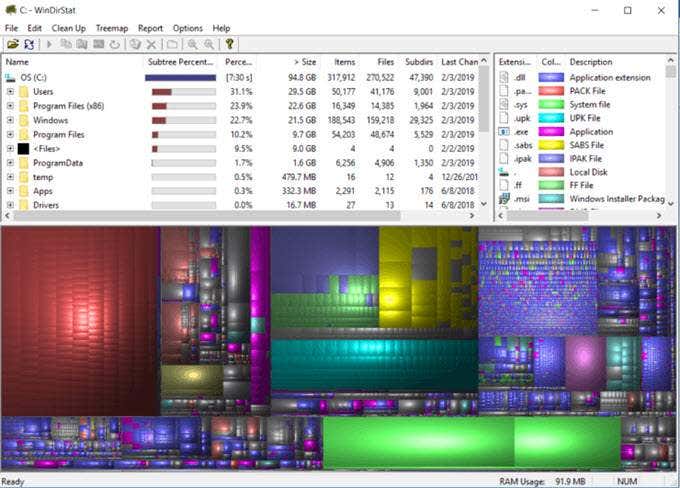
This is a powerful tool for analyzing your disk drives. Find which folders consume the most space and discover areas where you might have old files wasting space.
When you first launch the tool, it’ll perform a full disk drive scan and analysis. This information is presented in three areas and formats:
- Directory
list: Lays out an entire list of all directories on the drive - Treemap:
Shows you the contents of the directories in a creative tree format - Extension
list: See a list of all file types on the drive along with their statistics
The graphical display at the bottom lets you quickly spot what’s taking up most of the space on your disk drives.
If you click on the largest areas, you’ll see a list of those files and their locations so you can remove them and quickly clean up your drive space.
CrystalDiskInfo
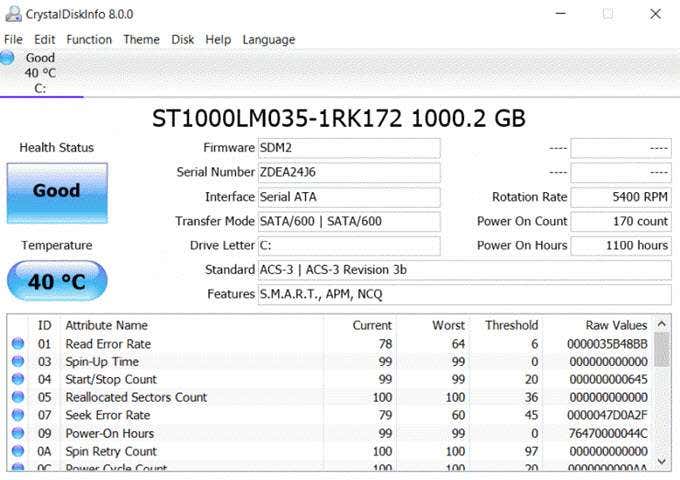
This free utility is another useful tool for analyzing the hard drives on your system. It’s a useful tool for monitoring your drives and making sure they’re running optimally. View temperatures, error rates, power issues, and more.
Key features of CrystalDiskInfo include:
- Acoustic and power management controls
- S.M.A.R.T. drive graphs
- Set up alert emails for when your disks are
experiencing issues - Get system notifications when there are errors
This is a simple app, but it’s very powerful for getting a jump on disk issues before they get to serious and you lose all your data.
HWiNFO
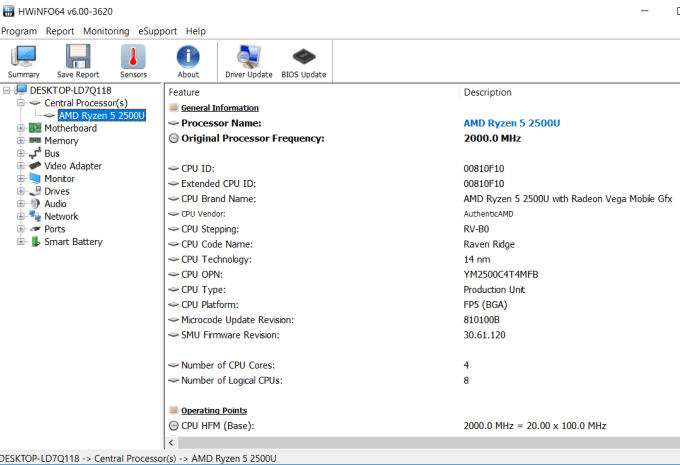
This impressive diagnostics utility combines existing Windows diagnostics tools all into one single package.
It provides you with insight into your entire system, including information about hardware in your system, real-time monitoring of all your system components, and the ability to log and export in-depth reports about your computer.
Features include:
- Detailed information about all hardware listed
in the Device Manager - View data from all sensors installed inside your
computer - Generate reports of the data gathered by the
utility - Customize the utility using HWINFO64 Settings
hddscan
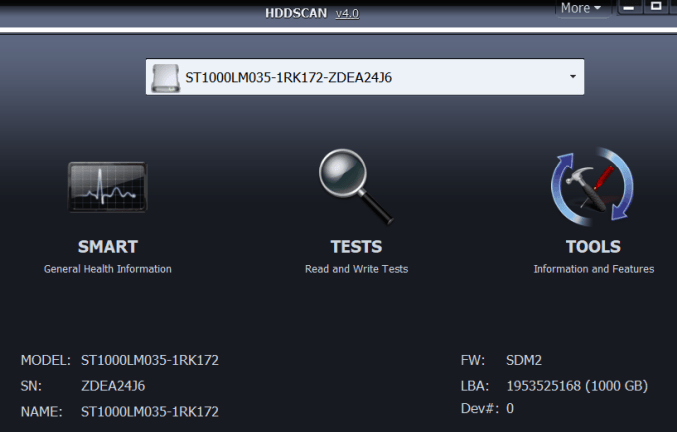
This freeware tool provides you with multiple tools for hard drive diagnostics for any kind of hard drive, including RAID arrays, USB drives, or SSD drives.
The software includes test features for checking for bad blocks, bad sectors, and gathers multiple parameters about your hard drives.
Features include:
- Health test your drives
- Predict the life of your drives based on
degradation - Get a full S.M.A.R.T report of your drives
Windows Sysinternals Suite
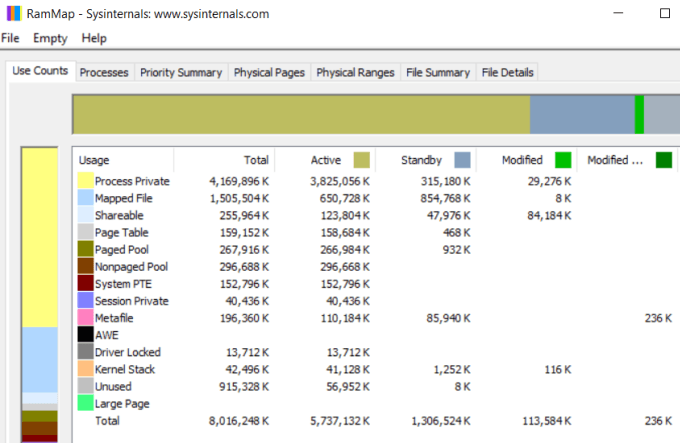
Process Explorer listed in #1 is a SysInternals app available for download from the Microsoft website. SysInternals offers an entire suite of utilities and tools. You can download them all at once by downloading the entire suite.
This suite includes utilities like:
- AdExplorer
- Autologon
- ClockRes
- Coreinfo
- Desktops
- DiskView
- PageDefrag
- RAMMap (image shown above)
- Sysmon
- TCPView
- Much more
If you want software that can monitor processes, hardware, services, and everything else about your system, this utility suite is probably the best single diagnostics suite you can download.
Malwarebytes
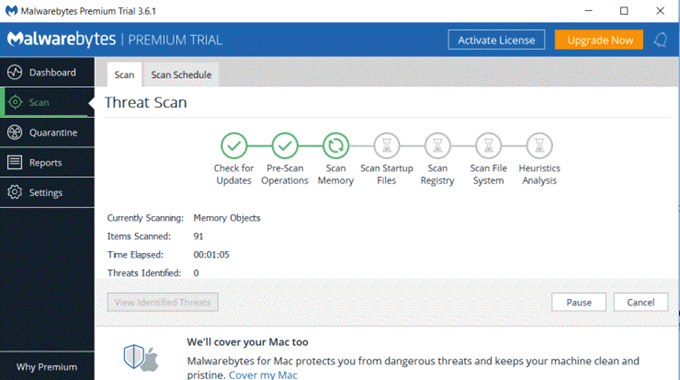
Malware is a scourge that infests computers, slows down your system, and interrupts your time spent on the internet. Antivirus software is great for cleaning up viruses and infected files, but it can sometimes overlook malware.
Malwarebytes is a tool built specifically to identify and clean your system of any malware that might have made its way into your system.
Using Malwarebytes is also easy. Once you install it, just run a full system scan and see what the utility discovers. You can also configure the application to run automatically on a schedule, so you don’t have to worry about your system getting cluttered with more malware as time goes on.
JScreenFix

This online utility is probably the easiest diagnostics tool to use since it’s web based.
If you’ve ever had a bright dot that remains on your screen no matter what you do, this is caused by what’s known as a “stuck pixel”. You can look for these by viewing a black screen and looking for light dots.
Using the JScreenFix utility, you can drag the static block over the stuck pixel, and it’ll fix the problem in less than 10 minutes.
ESET SysInspector
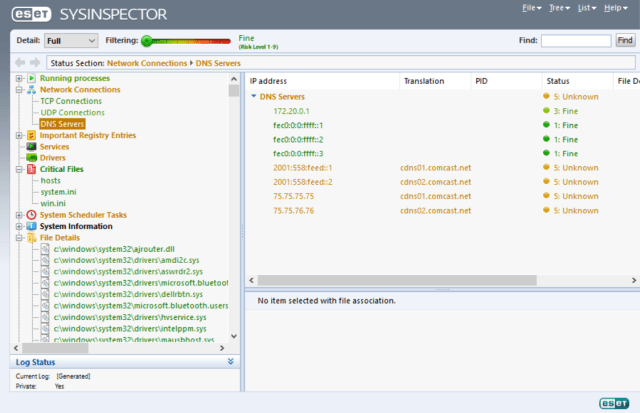
If you don’t want to dig through system errors and troubleshoot yourself, you could try this all-in-one tool that’ll scan your system and try to diagnose typical system issues for you.
It’s a free application that’s normally integrated into the ESET Antivirus software. It’s at least an excellent first tool to try if you’re not sure where to start. The software scans and detects issues with all the following:
- Processes and services
- Suspicious files
- Problem software
- Incompatible hardware
- Outdated or problem drivers
- OS files that require updates
- Registry problems
- Suspicious apps accessing the network or internet
Even if you don’t find the answer, it’ll at least point you in the right direction.
Debug Diagnostics 2
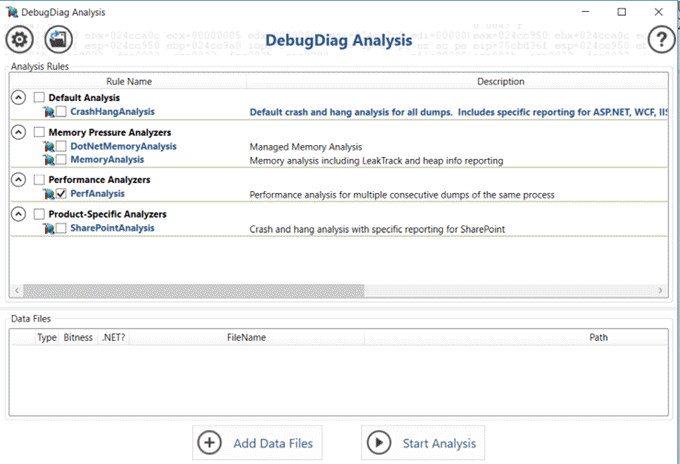
This tool for advanced Windows users allows you to take full memory dumps of a Windows process and have Debug Diagnostics analyze the file.
This diagnostics tool will allow you to analyze dump files in a way that’s easier to understand than digging through the files yourself.
This tool is best suited for users who already understand how dump files work (and how to create them). The tool will make your job analyzing these files much easier.
Using Windows Diagnostics Tools
As you can see there are many tools available for many different purposes. The one you choose depends on what kind of problems you’re having.
The list above should help you decide which one to download and use to fix whatever Windows problems you may be having.
Related Posts
Ryan has been writing how-to and other technology-based articles online since 2007. He has a BSc degree in Electrical Engineering and he’s worked 13 years in automation engineering, 5 years in IT, and now is an Apps Engineer. Read Ryan’s Full Bio
