When most people think of data analysis, they think of manipulating and analyzing data in a tool like Microsoft Excel. The reality is that data analysis encompasses a wide range of tools and a lot of different methods to manipulate and understand the story that the data tells.
What is data analysis? Data analysis is used very differently if you’re talking about business data, manufacturing data, marketing data, or data specific to the industry and business that you operate.

In this article, you’ll learn about the different aspects of data analysis, what they mean, and how they’re generally used across the board.
Data Collection
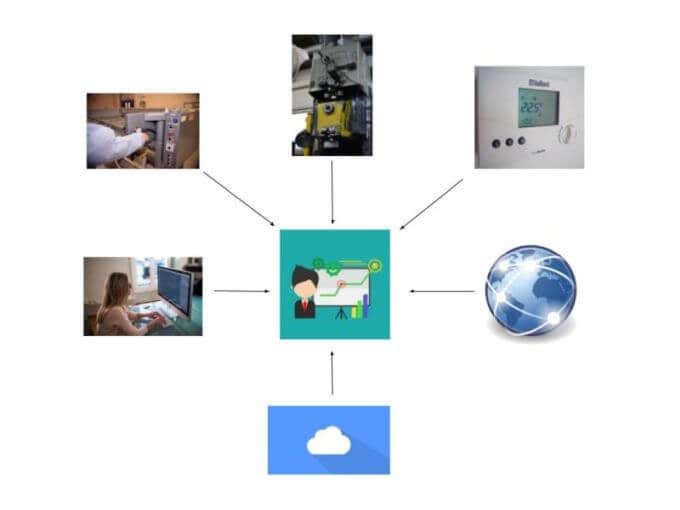
The first stage of any data analysis is data collection. This simply means gathering data from all of the sources that hold information you need.
Data can include any of the following and more:
- Manufacturing machinery controllers
- Someone manually entering data into a computer
- Sensors that measure temperature, pressure, and more
- Cloud based data sources
- Information from the internet like weather or government databases
- Databases housed on your company network

A major challenge for a lot of organizations is figuring out what technical tools are available to gather that information. Most of the time software is required to connect to that remote device or data source and then pull them into an internal database or data historian system.
These storage areas are often referred to as a “data warehouse”.
Once information is collected into a data warehouse inside an organization, various tools can be used to conduct the actual data analysis.
Business Intelligence
Once data is collected, the next step is deciding what to do with all that data. When it comes to business intelligence, the required data should help an organization make better business decisions.
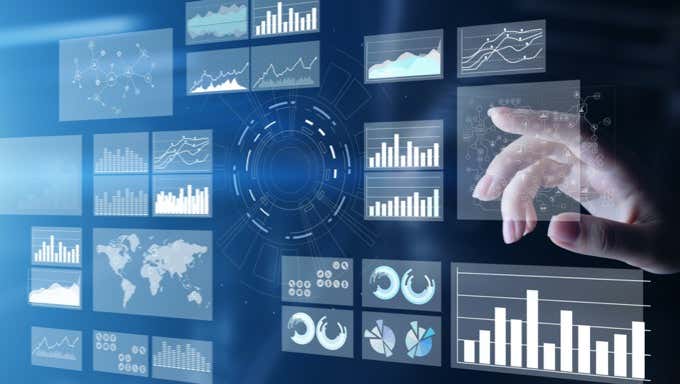
Business Intelligence (BI) reports and dashboards help managers and other business leaders better understand trends and gain insights into various aspects of the business.

These aspects include:
- Supply chain needs or limitations
- Reducing costs
- Improving sales
- Customer needs and behaviors
- Predicting future sales or market demands
- Logistics and shipping
Gathering data from all of these different systems throughout your organization lets you build connections between information that may never have been possible before.
Manufacturing Intelligence
The difficulty when it comes to gathering data from manufacturing processes is that usually there’s just so much of it.
If you think about a typical manufacturing facility, every single machine on the shop floor collects dozens to hundred of data points that include:
- Temperatures and pressures
- Parts or product made
- Raw material used
- Bad parts scrapped
- Malfunction counts and alarms
In most cases, manufacturing equipment is automated by the use of a programmable logic controller (PLC). These devices not only run the equipment according to how they’re programmed, but they also collect and gather data from that equipment.
Getting data out of those PLCs involves software that runs on a server on the same network as those PLCs. There are many vendors that have written software to get data out of those controllers and into a data historian or a database.

The data historian leaders in this area include:
- OSIsoft: This company has been around for decades, and includes “integrators” or drivers that can get data out of almost any kind of processor, sensor, or database.
- Factorytalk: Long time automation leader Rockwell Automation produced their own data historian called Factorytalk to help their customers collect data from machine processors.
- Aveva: Formerly known as Wonderware, the AVEVA Historian promises to provide “open access” to machine data like process data, alarms, events, and more.
- Iconics: A smaller player in the data historian marketplace, the makers of Iconics promise to provide “high-speed archiving” so the stored data resolution matches what originally occurred on the machine.
Nearly all of these software providers include data analysis tools to go along with their data historian solution. Choosing the right data collection and analytics solution for your manufacturing facility really depends on the controllers you use, how you want to store the data, and how much you are willing to spend.
Data Visualization
The most popular tool for collecting, analyzing, and visualizing business data is Microsoft PowerBI.
PowerBI is a powerful visualization tool offered by Microsoft that lets you bring in data from many different data sources. You can then slice and dice the data across various pie and bar charts, line graphs, tables, and more.
The ability to combine information from various data sources lets you find correlations that wouldn’t have been possible before. This is the magic of modern data analysis. It provides the ability to gain insights that were never before possible before tools that let you visualize data from many sources.
PowerBI isn’t the only app with the ability to manipulate and visualize data in this way. In fact, there’s a growing market for just these types of tools.

The leading data visualization tools today include:
- Metabase: An open-source (free) solution that touts itself as letting people in your organization “ask questions and learn from data”.
- Tableau: A popular data visualization platform used across many different industries. Connectivity with many different data sources is available.
- Whatagraph: Popular among marketing agencies because it’s easy to produce easy-to-understand reports. The tool includes automated report generation and can automatically email those to anyone.
- JasperReports: This is another open-source reporting solution. It’s power comes from the ability to output reports in many different formats like printed documents, PDFs, and web-based reports.
The option you decide to go with really depends on the investment you or your organization wants to make. Thankfully there are excellent open-source options available if that’s where you need to start.
Data Mining
One of the most powerful new data analysis techniques is something called data mining.
Data mining focuses on using statistical modeling to pull patterns and trends out of a large volume of data in order to predict future trends.
The applications that can perform data mining statistical analysis are highly specialized and often need to be customized to the application or situation at hand.
Types of data mining analysis include:
- Exploratory Data Analysis (EDA): This involves searching for patterns in data in order to identify new trends or learn new information.
- Confirmatory Data Analysis (CDA: This involves using all of the collected data to try and determine whether suspected correlations are true.

Some of the leading data mining software tools available on the market today include:
- Rapid Miner: An excellent open-source predictive analysis system written in Java. It’s capable of machine learning, predictive analysis, and text mining.
- Sisense: Licensed software tailored for business intelligence, with the ability to scale up for large organizations. It includes an excellent reporting module.
- Oracle: One of the leading names in the data industry, Oracle offers data mining feature within SQL that lets organizations use data stored in an Oracle database.
- IBM Cognos: This software is capable of processing large volumes of data to identify important trends. These can be used to generate reports for management or others.
- SAS: Another big name in the data industry, Statistical Analysis System (SAS) was specifically designed to mine, manage, and even update data based on analytical results.
As you can see, there are many facets to data analysis and the tools you need to use really depends on what you hope to learn from that data.
Advancements in data analysis continue to advance every year, and any company or organization that hopes to stay ahead in their industry needs to stay on top of what data analysis tools are available and to use them to their fullest potential.