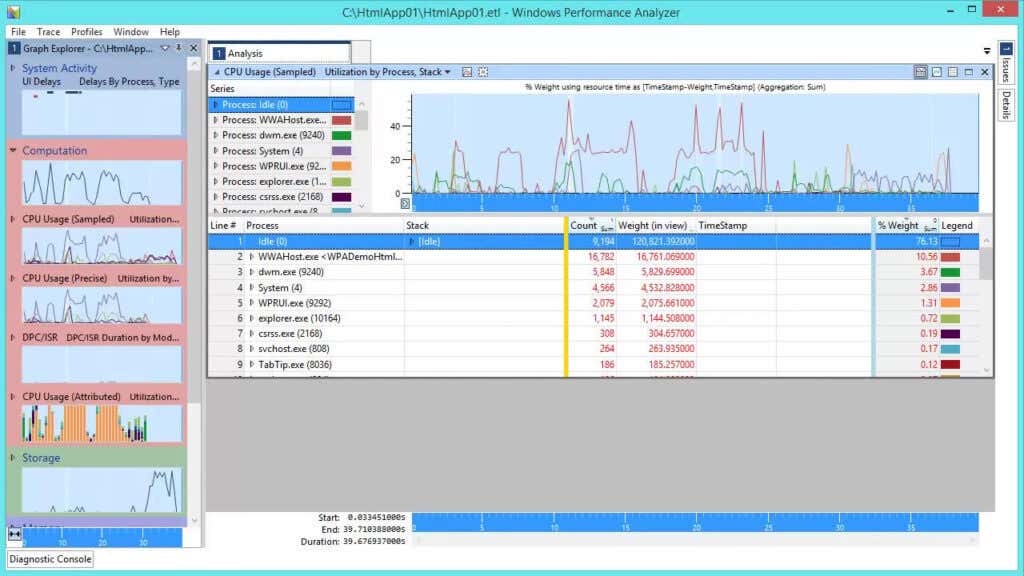
The Windows Performance Analyzer (WPA) tool is a part of the Windows Assessment and Deployment Kit (Windows ADK). It’s the tool you can use to create graphs and tables based on event trace log recordings. You make these trace files using tools like Xperf or Windows Performance Recorder (WPR). These tools are useful if you have system performance issues. You can also use them regularly for performance monitoring.
In this article, you’ll learn how to create a quick recording using the WPR. You should launch this recording during an event where you want to test the performance of your computer. This could be launching a game or other application or even running a program you’ve written. Then, we’ll cover how to use the WPA tool to read and analyze that data file for troubleshooting purposes.
Installing and Launching Microsoft Windows ADK Tools
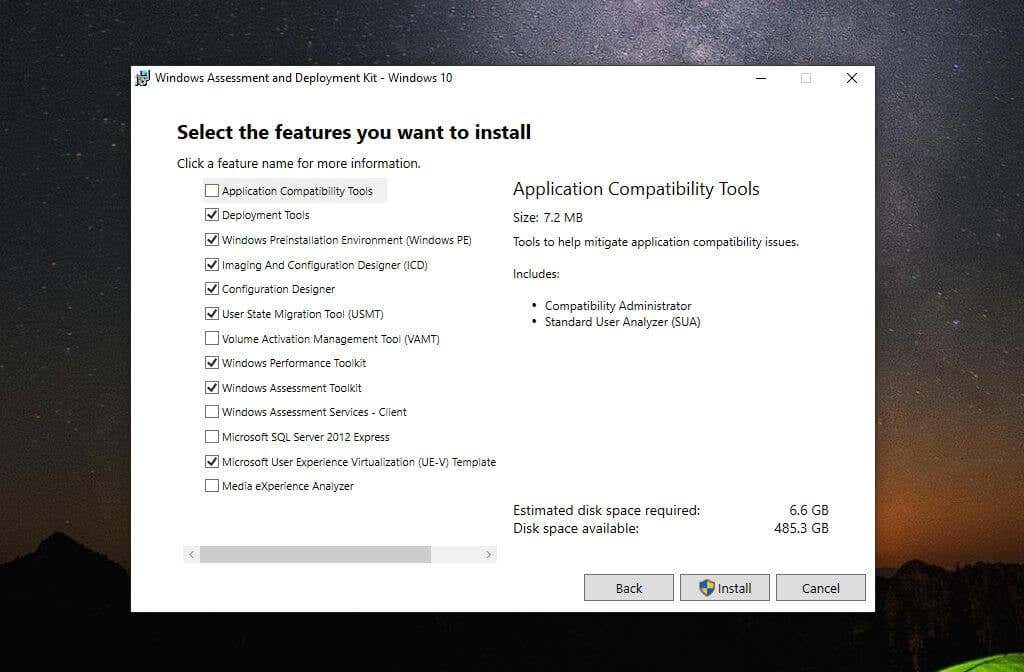
The first step to install both the WPA and WPR is to install Windows ADK from Microsoft’s download page for the Windows Performance Toolkit. This tool is from Microsoft.com, so completely safe to install. As you step through the installation process, you’ll need to choose the components you want to install.
Just make sure that the Windows Performance Toolkit is selected since this includes both tools you need.
Once you select Install, the process can take time, so be patient.
When the Windows Performance Toolkit installation is complete, you’re ready to make your first WPR recording.
Note: For this example, we’ve installed the HeavyLoad Stress Test app to put our system under a heavy load while the WPR recording occurs.
Before using the Microsoft Windows Performance Analyzer tool, you’ll need to use the Windows Performance Recorder to capture an event trace log recording (an ETL file). This recording will contain all Event Tracing for Windows (ETW) events. WPA analyzes all system information about CPU, memory, storage, and more.
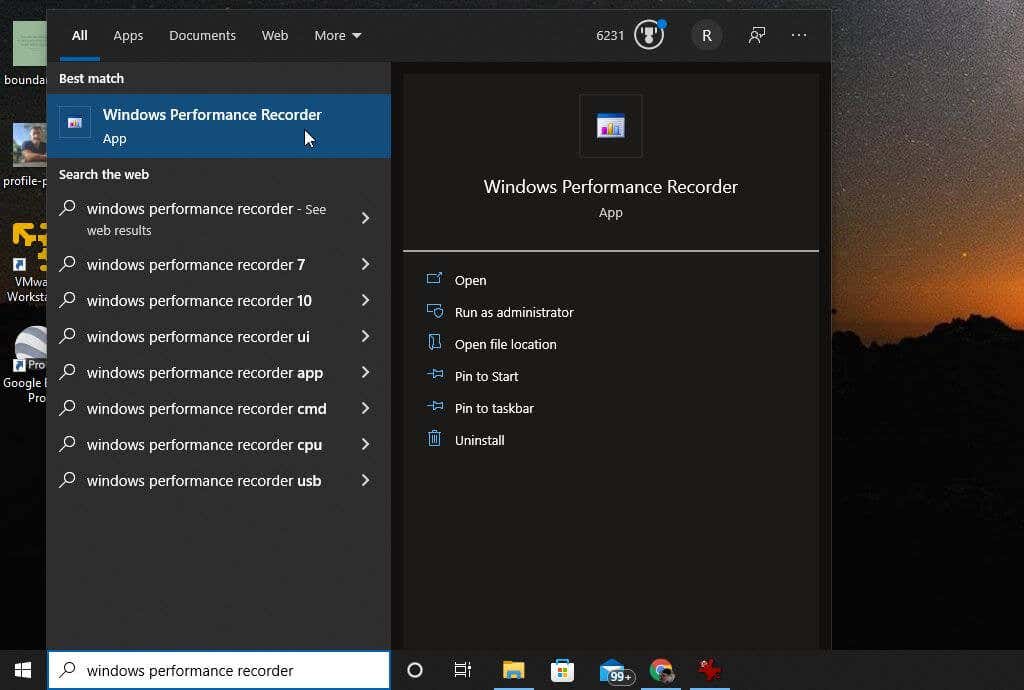
To launch WPR, select the Start menu and type “Windows Performance Recorder.” Next, select the Windows Performance Recorder app.
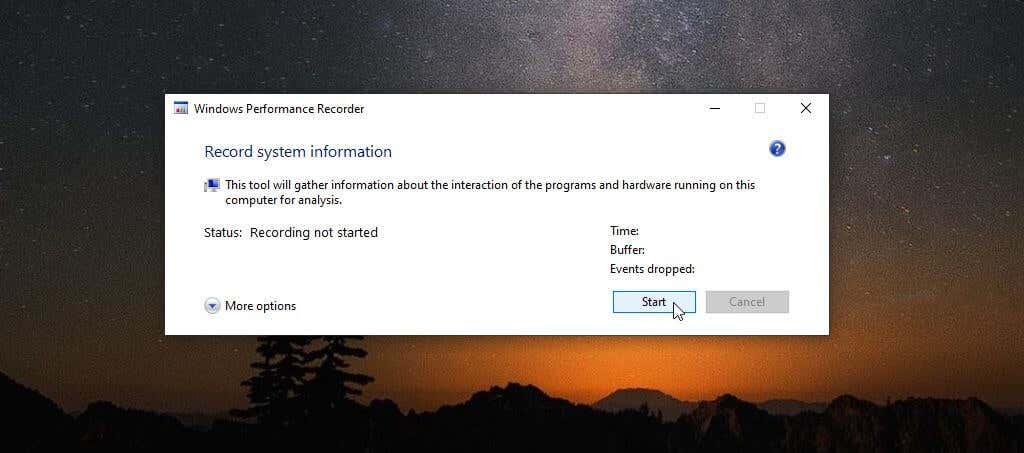
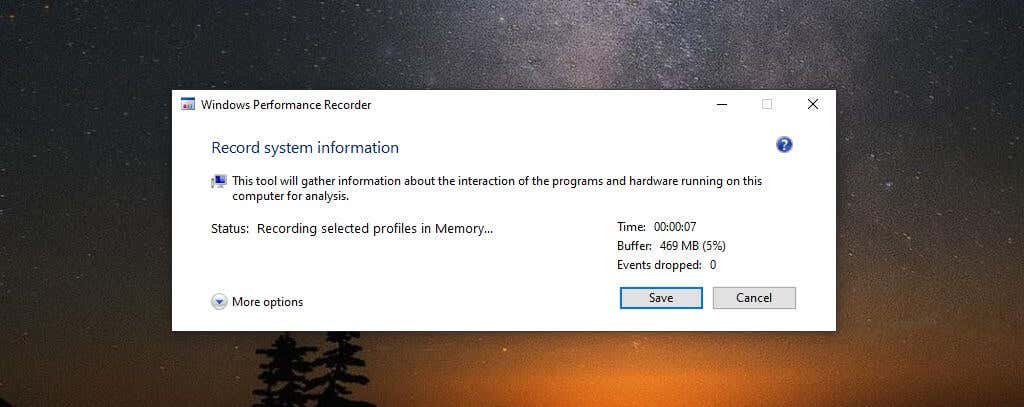
The WPR tool is a straightforward tool to capture events occurring on your system during a specific timeframe. To start the recording, just select the Start button.
This will launch the system event recording process. Perform actions (like launching and running a program) that you want to use to test your system’s performance.
Once finished, just return to the WPR window and select the Save button.
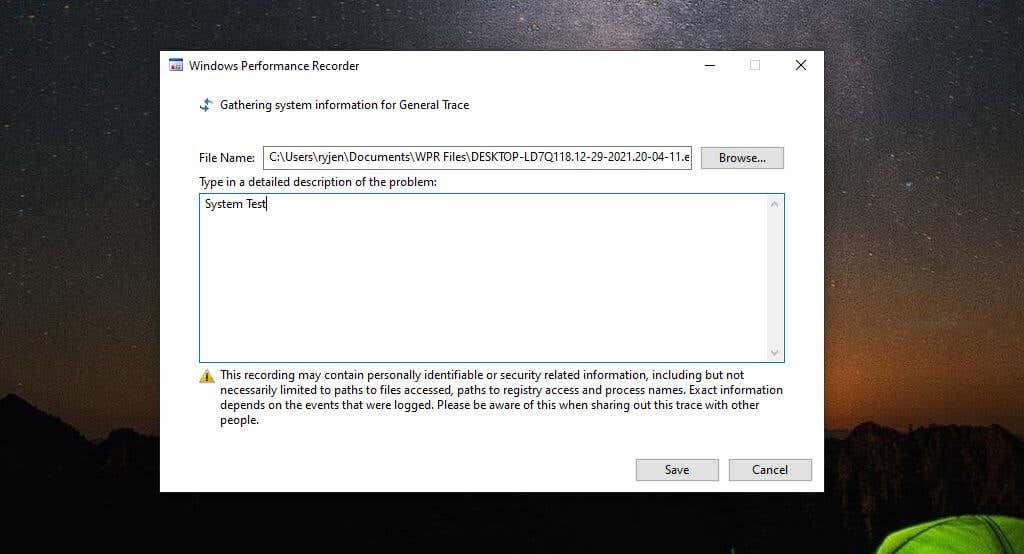
The next step will display the path to your ETL file. You can include a description of what you’re troubleshooting or testing in the detailed description window.
When done, select the Save button.
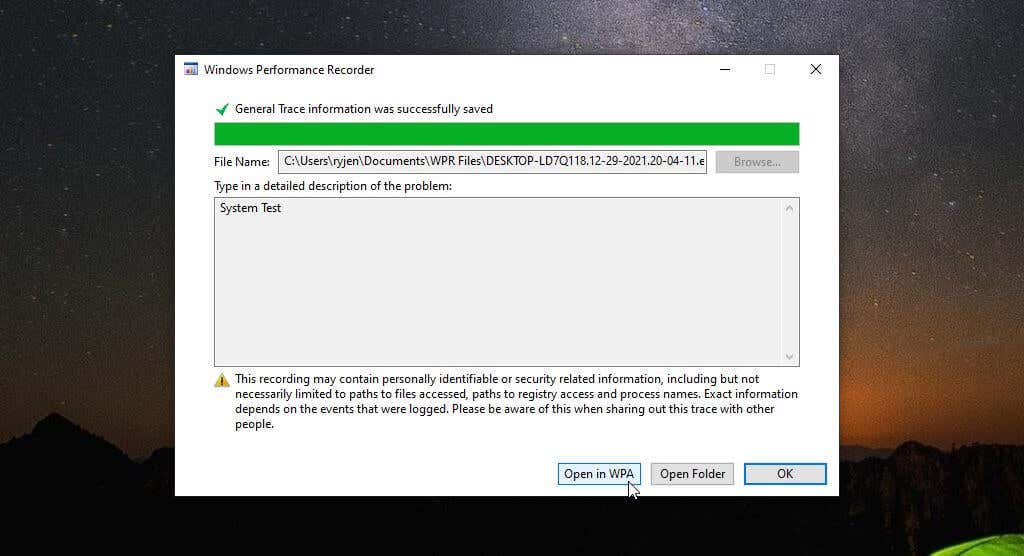
The app will write all data to the ETL file, and you’ll see options at the bottom of the window to open the WPA tool directly or navigate to the ETL file by opening the folder.
The most convenient way to immediately move on to your performance analysis is to select the Open in WPA button.
Analyzing ETL Files with Windows Performance Analyzer
Once you double-click the WPA app and it launches, you’re ready to start navigating through and visualizing the data in the ETL file. This is a special log file only certain apps can open. You couldn’t view it using something like Google Docs or Microsoft Word.
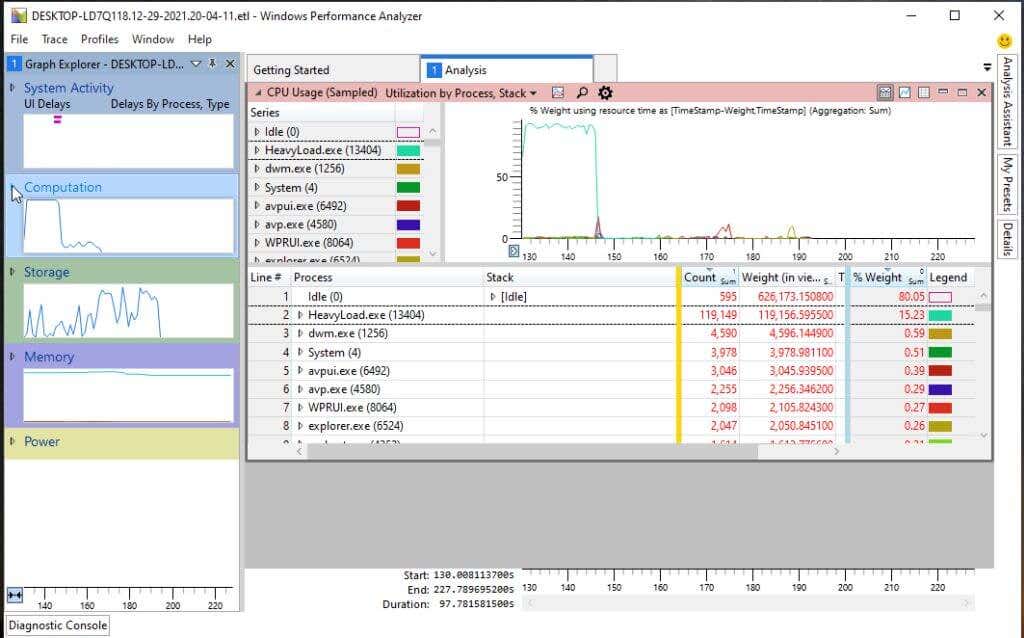
You’ll notice along the left side there are four major categories of data to explore. You can select any of these charts on the left to see them displayed in more detail in the right pane.
These categories include:
- System Activity: Process information, background tasks, events, and more.
- Computation: All information related to CPU cores.
- Storage: Disk usage information.
- Memory: Real and virtual memory usage.
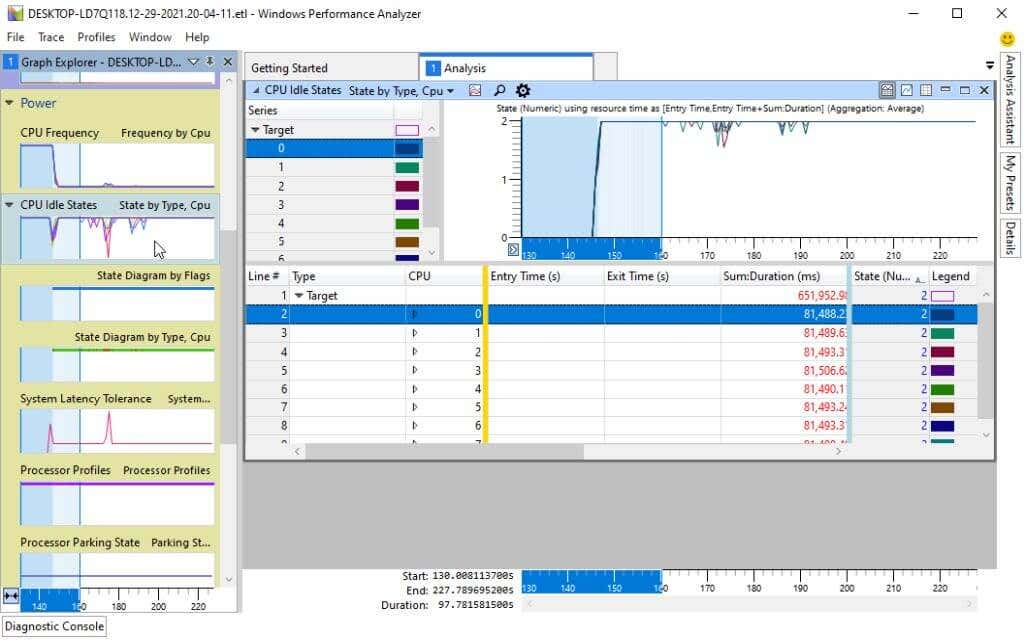
- Power: Processor power usage details.
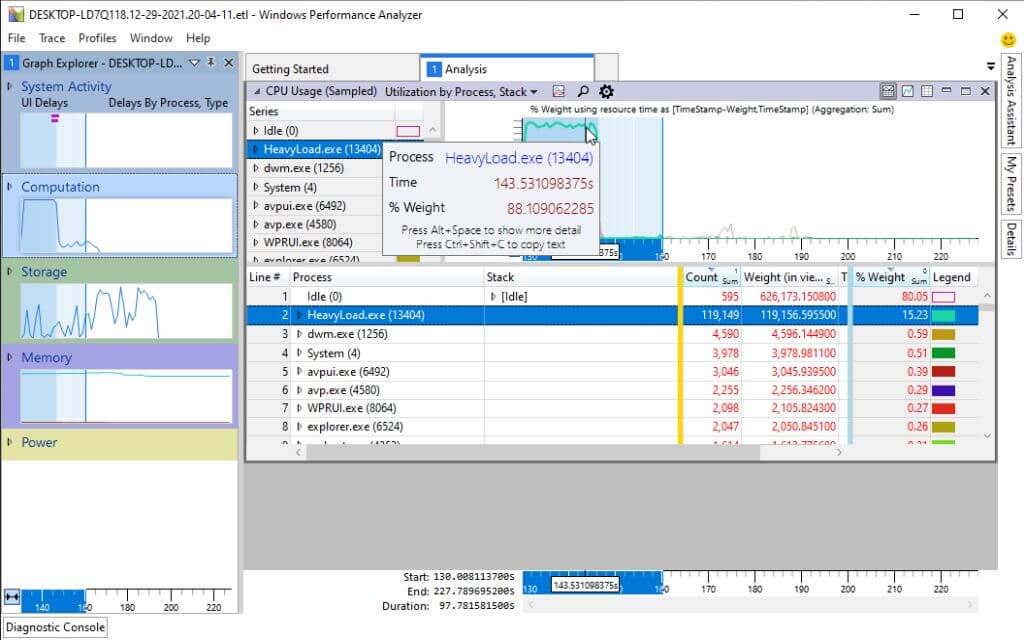
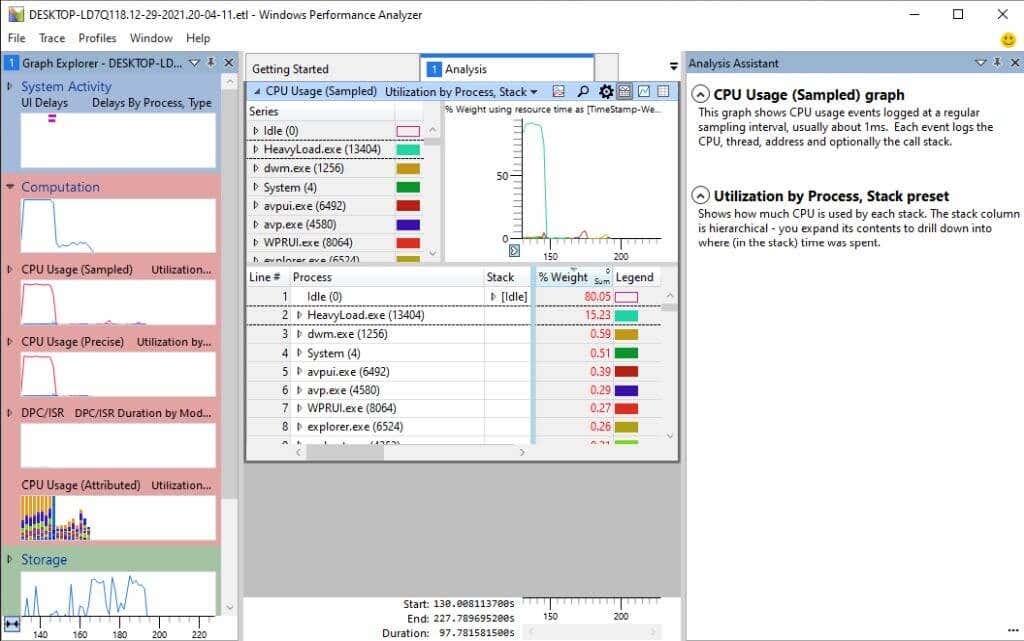
In each chart, like the CPU Usage chart, you can hover over any graph area to see a breakdown of the data components like process name, process active time, and percentage of overall CPU usage.
If you select a specific process name from the list at the bottom, you’ll see highlighted areas in the graph to identify the specific times that process consumed CPU resources. This can help identify whether operating system processes or application processes are eating up all CPU time.
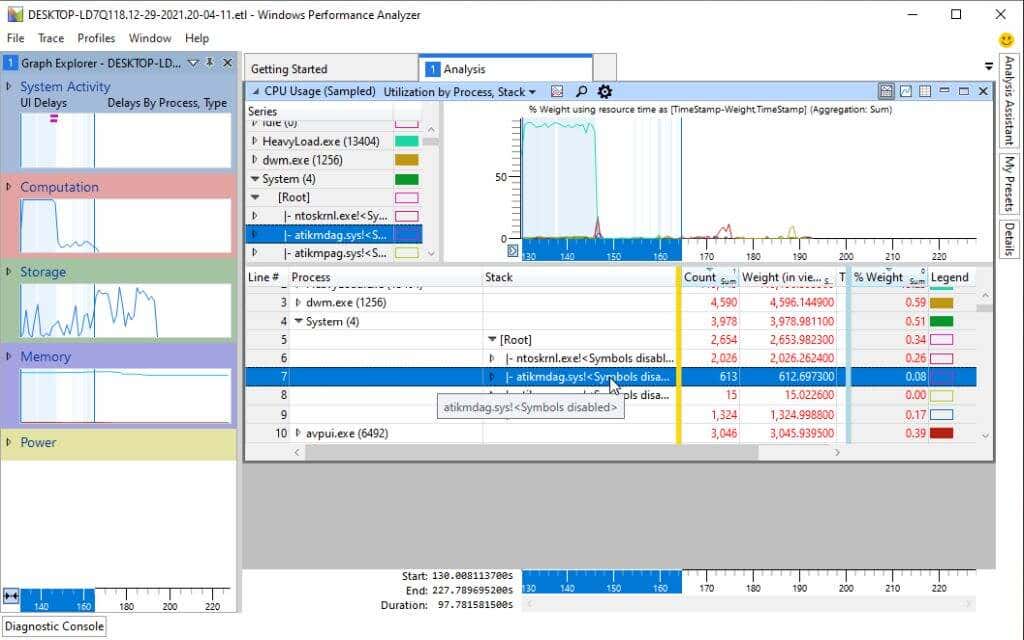
You can also drill down into each process to see specific stack activity, again with the graph above highlighting areas when that stack was actively using CPU time.
Available Charts in WPA
Inside each of the four major categories in the left pane, you’ll find a graph explorer that can help you analyze and troubleshoot what’s happening with your system performance.
We’ve covered the System Activity list above. Below this, you’ll find the Computation category.
Here you’ll find the following sub-charts:
- CPU Usage (Sampled): Samples of CPU activity taken at sampling intervals.
- CPU Usage (Precise): CPU usage associated with specific running process threads.
- DPC/SR Duration: CPU time spent servicing deferred procedure calls (DPCs).
- CPU Usage (Attributed): CPU usage broken down into several categories.
Again, you can select any of these sub-charts to display them on the right. Or you can drill down further into more sub-charts related to each of these areas.
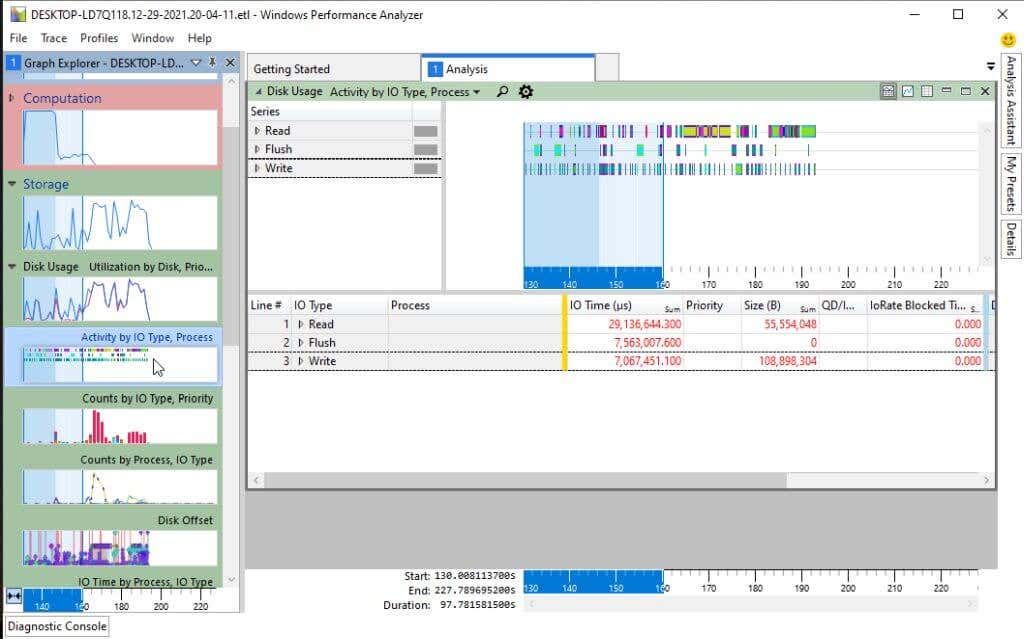
The Storage category has several disk usage sub-visuals underneath it in the left navigation pane.
You can view overall lDisk Usage or drill down into any of the following sub-visuals:
- Disk activity
- Disk Counts
- Disk Offset
- IO Time
- Service Time
- Disk Size
- Disk Throughput
- Disk Utilization
Adding one or more of these to the same pane on the left lets you compare different aspects of disk usage to one another. This kind of comparison alongside visuals related to processes or CPU time could potentially help you identify the source of your Windows performance problems.
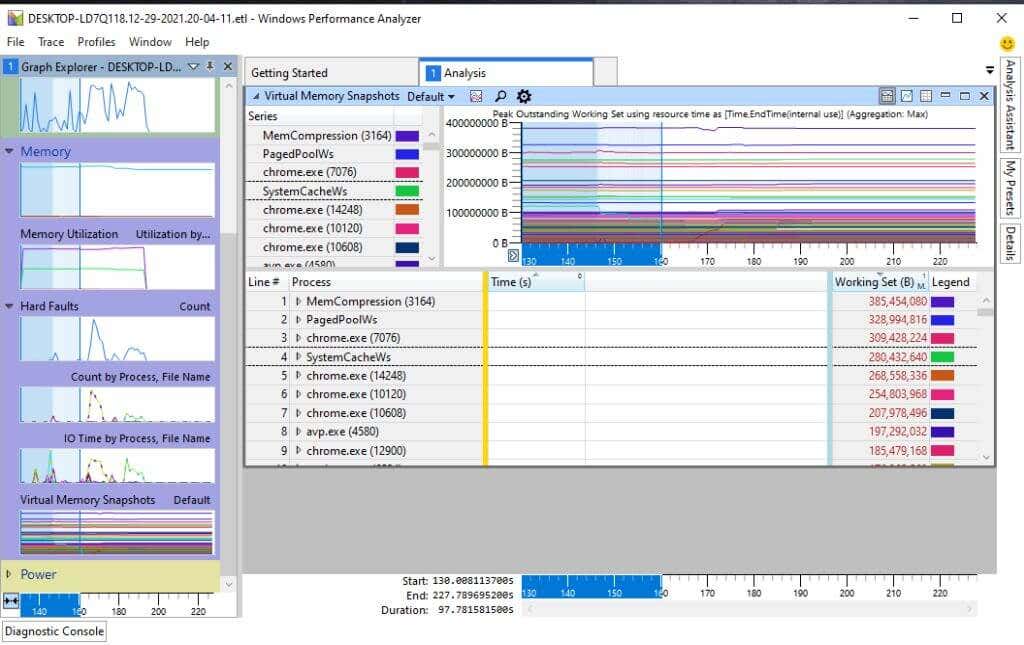
The next category in the left navigation pane is Memory.
You’ll find the following charts under the Memory category:
- Memory Utilization
- Fault Counts
- Fault IO Time
- Virtual Memory Snapshots
Finally, the last category in the list is Power. These are all visuals related to your system’s overall CPU power consumption.
This includes all of the following sub-visuals around all system processors like CPUs and GPUs:
- CPU Frequency
- CPU Idle States and State Diagram
- System Latency Tolerance
- Processor Profiles
- Processor Parking State
- Core Parking State
- Processor Performance
- Processor Constraints
Other Microsoft WPA Features
There are several useful features in the WPA tool that’ll help you with your troubleshooting efforts.
One of those is an Analysis Assistant. You can find this by selecting the Window menu and selecting Analysis Assistant.
This opens up a new pane in the tool that will give you tips and details about the charts or items inside the charts that you click on.
This is especially useful if you aren’t that familiar with all of the terminology used throughout the tool.
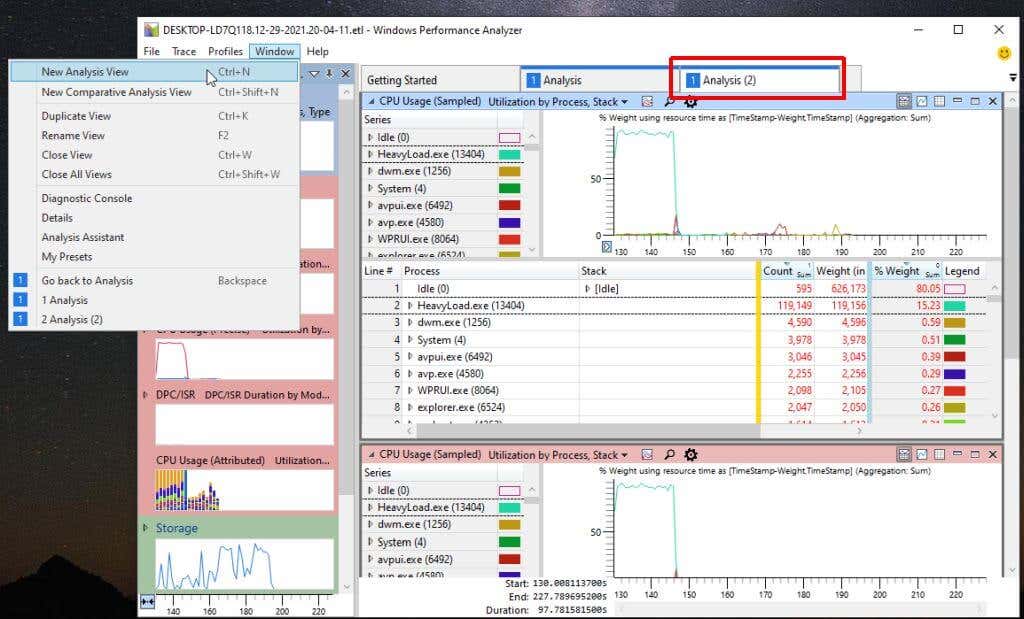
If you select the Window menu and select New Analysis View, you can open a new Analysis tab.
This lets you perform multiple analyses by adding a family of visuals in one tab and then opening a new tab to perform a completely different set of visuals without losing your previous analysis. Flip back and forth between tabs to work on each analysis individually.
Exploring Windows Performance Analyzer Further
If you’d like to dig even further into WPA, Microsoft has an old Microsoft Docs guide. The documentation isn’t being maintained anymore, but it should point you in the right direction. It even includes a full command line reference you can use to run WPA commands from the command prompt.
As you can see, the Windows Performance Analyzer tool is much more flexible and useful than standard performance tools that come installed on Windows by default. So, the next time your Windows system starts acting unusual, take the time to download the Windows ADK and give WPR and WPA a try.
If you’re using Linux (or Android), a GitHub Linux version of a similar tool is available using the Microsoft Performance Toolkit.
Related Posts
- How to Fix App Notifications in Windows?
- Preparing for Windows 10 End of Support: Upgrading to Windows 11
- How to Fix a “This file does not have an app associated with it” Error on Windows
- How to Fix an Update Error 0x800705b4 on Windows
- How to Resolve “A JavaScript error occured in the main process” Error on Windows
Ryan has been writing how-to and other technology-based articles online since 2007. He has a BSc degree in Electrical Engineering and he’s worked 13 years in automation engineering, 5 years in IT, and now is an Apps Engineer. Read Ryan’s Full Bio
