As you know, there are many mathematical calculations you can perform with Microsoft Excel. In this tutorial, we’ll walk you through the steps involved in calculating Z-Score in Excel.
If this is your first time using Excel, we recommend you take five minutes to peruse this Microsoft Excel beginner’s tutorial. You’ll learn how essential functions work, navigation shortcuts, creating workbooks, formatting data, and everything there is to know about using the spreadsheet program as a beginner.
When you’re done with that, proceed to the next section to learn how to calculate Z score in Excel. But first, let’s briefly explain Z-Score, its uses, why you might need to calculate one, and how to get it done.
What Is a Z-Score?
Z-Score (also known as a “Standard Score”) is a metric that highlights the relationship between values in a distribution. More precisely, it describes the position of values in a dataset with respect to their mean and standard deviation. Z-Score allows for accurate measurement and comparison of values in a dataset.
The mathematical formula for calculating Z-Score is (x-µ) / σ; where x = Cell Value, µ = Mean, and σ = Standard Deviation.
Companies sometimes use Z-Score to forecast and estimate impending bankruptcy. Additionally, it’s a great metric for ascertaining the financial position of an institution. Researchers also utilize Z-Score to compare observations obtained from different samples or populations.
How to Calculate Z-Score in Excel
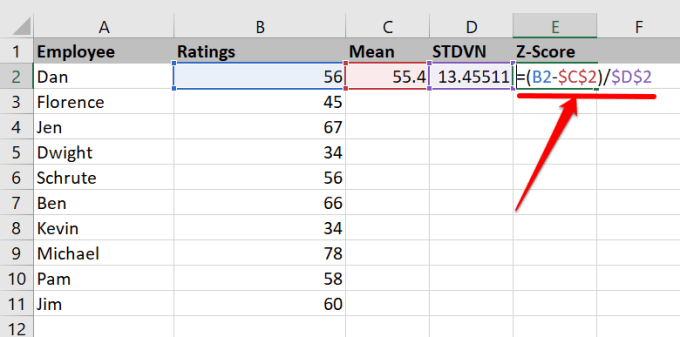
Since Z-Score is a function of mean and standard deviation, you’ll need to first calculate the average and standard deviation of your dataset. Although you can extract the mean and standard deviation in any cell, we created dedicated columns for “Mean” and “Standard Deviation” in our worksheet. We also created a column for “Z-Score.”
Our sample document contains the performance ratings of 10 employees in a paper company. Now let’s calculate the Z-Score of the employees’ rating.
Calculate Mean Average
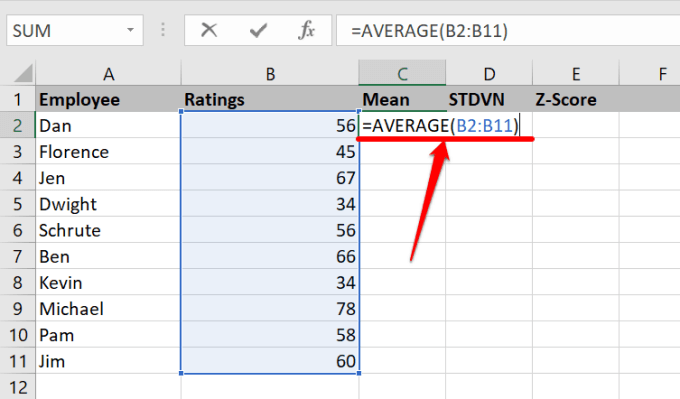
To calculate the mean average of your dataset, type =AVERAGE(, select the first value in the dataset, press the column key, select the last value within the dataset range, press the closing parenthesis key, and press Enter. The formula should look like the one below:
=AVERAGE(B2:B11)
You should see the mean or average value of the dataset in the cell you entered the formula.
Calculate Standard Deviation
Excel also makes it pretty easy to calculate the standard deviation of your dataset in a few clicks.
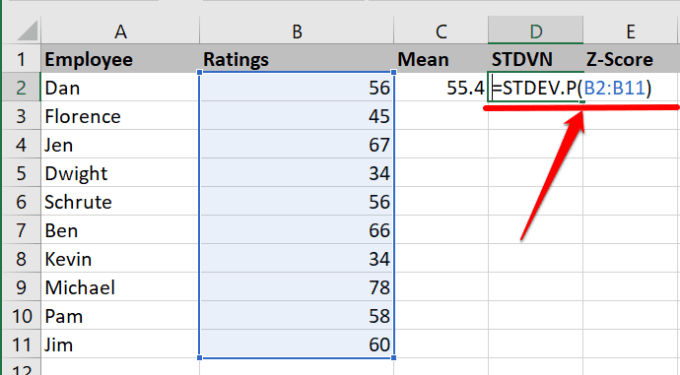
Select a cell in the “Standard Deviation” column, type =STDEV.P(, then select the first value in the range, press the column key, select the last value, enter the closing parenthesis, and press Enter. If you’re in doubt, the resulting formula should be similar to the one below:
=STDEV.P(B2:B11)
Calculate Z-Score in Excel: Method 1
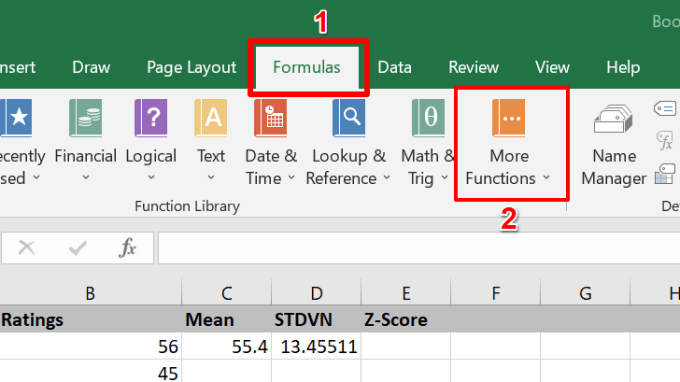
Excel has a STANDARDIZE function that provides the Z-Score of a dataset in a distribution. Select the first cell in the Z-Score column and follow the steps below.
- Go to the Formulas tab and select More Formulas.
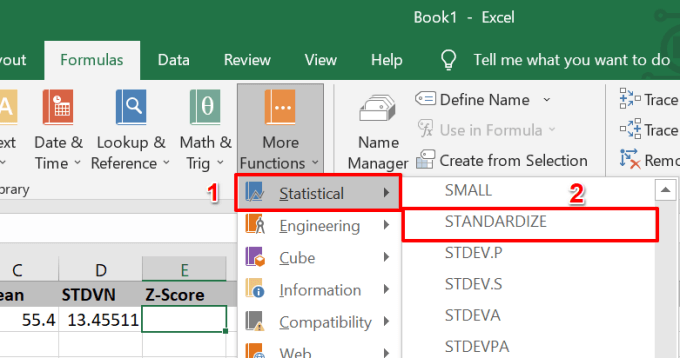
- Hover your mouse on the Statistical option and select the STANDARDIZE.
That’ll launch a new Function Arguments window where you’ll be able to calculate the Z-Score of the distribution.
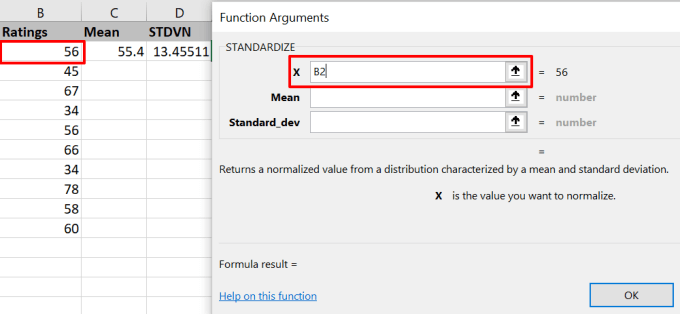
- Enter the cell reference of the first value in the “X” field.
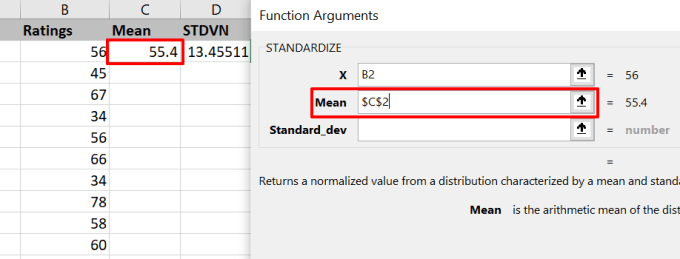
- Enter the cell reference of the arithmetic average in the “Mean” field and press the F4 on your keyboard to lock the cell reference.
- Finally, enter the standard deviation’s cell reference in the “Standard_dev” field and press F4 to lock the cell reference. The tool will display a preview of the Z-value. Press OK to proceed.
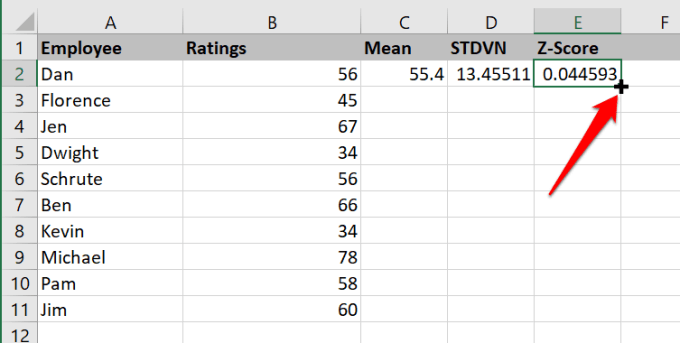
To get the Z-Score for other values, hover the cursor to the bottom-right corner of the cell and drag the plus (+) icon down the column.
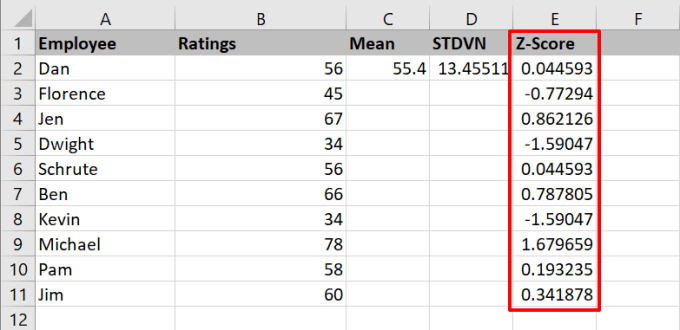
Excel will copy the formula down the column and automatically generate the Z-Score for other values in the corresponding rows.
Calculate Z-Score In Excel: Method 2
As mentioned earlier, you can obtain a datapoint’s Z-Score by subtracting the mean of the dataset from the datapoint and dividing the result by the standard deviation. Using the (x-µ) / σ, you can calculate z-score in Excel by inputting these values manually.
- Select the first cell in the Z-Score column, type an equal sign (=) followed by an open parenthesis, and select the first value in the column containing the datasets whose Z-Score you want to calculate. Afterward, type a hyphen, select the arithmetic mean, press F4 to make the mean absolute/fixed, and press the close parenthesis icon. Finally, press the forward-slash (/) key, select the standard deviation, and press F4 to lock the cell reference.
The final formula should look similar to this: =(B2-$C$2)/$D$2. Press Enter to execute the formula.
Note that the formula will only calculate the Z-Score for the first value in the selected cell.
- Hover your mouse to the bottom-right corner of the first Z-Score cell and drag the plus (+) icon down the column.
Interpreting Z-Score
Your dataset will most likely contain a mix of negative and positive Z-Scores. A positive Z-Score indicates that the value/score is higher than the dataset’s mean average. A negative Z-Score, of course, tells the opposite: the value lies below the mean average. If a datapoint’s Z-Score is zero (0), that’s because its value equals the arithmetic mean.
The bigger a data point, the higher its Z-Score. Go through your worksheet and you’ll realize that the small values have lower Z-Scores. Likewise, values smaller than the arithmetic mean will have negative Z-Scores.
In our sample worksheet, for instance, you’ll discover that “Michael” had the highest rating (78) and highest Z-Score (1.679659). “Dwight” and “Kevin” on the other hand both had the lowest ratings (34) and lowest Z-Score (-1.59047).
Become an Excel Expert: Tutorial Repository
You now know how to calculate the Z-Score of a data set. Drop a comment below if you have questions or other useful tips regarding calculating Z-Score in Excel.
We recommend reading Excel-related tutorials on calculating variance, removing duplicate rows in your dataset, and how to use summary functions in Excel to summarize data.
