If you’re running your own website and you care about how well you rank in Google search results, you’ll want to make sure you use the Google Search Console.
What Is Google Search Console?
Google Search Console tells you everything that the Google search crawler knows about your website. This provides some insight into how well your site is tailored for the crawler to pick up important information and to list your pages high in search results.
This information includes things like:
- How often people see your pages in search results
- How often people click on your pages in search results
- Any crawler errors the googlebot experiences
- Your robots.txt or sitemap.xml health
- Performance on individual site pages
Google previously offered this dashboard under the name “Google Developer Tools”, but recently revamped the tool and branded it Google Search Console.
How To Use The Google Search Console
In order to see Google Search Console stats for a particular website, you need to claim ownership over that “property” as Google calls it.
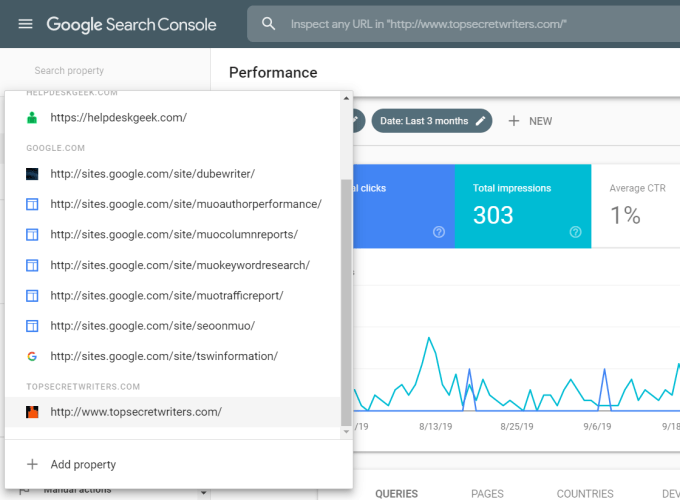
- To do this, log into the Google Search Console with your Google account, and select the down arrow at the upper right corner of the screen.
- If you already have ownership of existing websites, you’ll see them here. If you don’t, you’ll need to select the Add property link at the bottom of this dropdown.
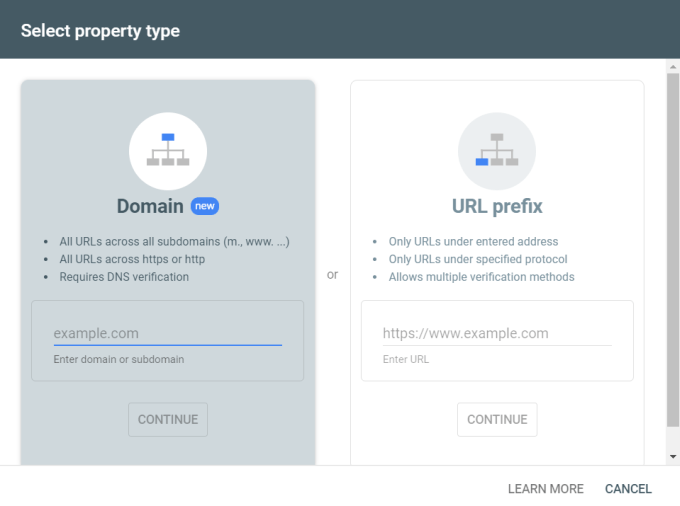
- On the initial wizard window, you’ll need to type the domain of the website you want to claim. If you are using an entire domain that you want to track, enter the domain on the left without the “https:” in front of it.
If you’re using a subdomain to launch this new website, you’ll want to use the field on the right and enter the entire path of the URL down to the subdomain. Google will only consider all URLs below the subdomain level to be part of your property.
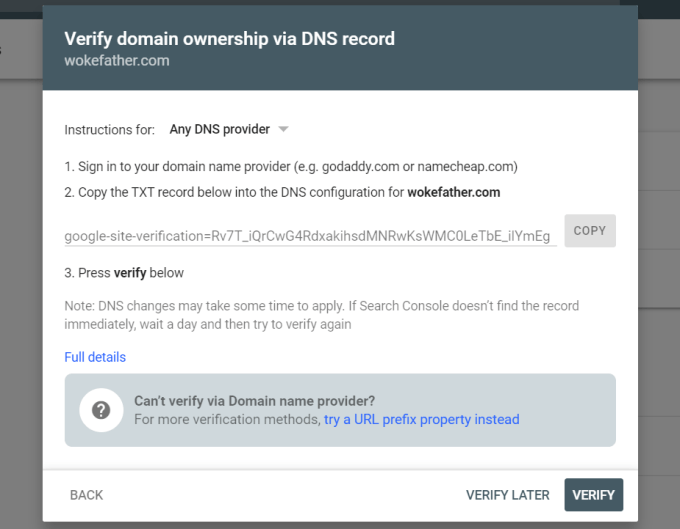
- In order to claim the domain as your own property, you’ll need to paste special code into the DNS configuration with the domain registration account you registered the domain with.
- Once you’ve verified the domain is yours, Google will add it to the list of your properties in the Google Search Console.
Using Google Search Console
The new version of the Google Search Console has a much simpler menu, with statistics buried in the individual reports you’ll have access to.
In the left navigation window, if you select Overview, you’ll see several reports show up in the main view.
- Performance: Number of times people clicked on one of your pages in search results
- Coverage: Shows how many pages on your site are being indexed by Google
- Enhancements: This shows updates about the mobile or AMP version of your pages and any related issues.
Site Performance
You can dig down into each of these areas by selecting the Open Reports link at the upper right corner of the chart.
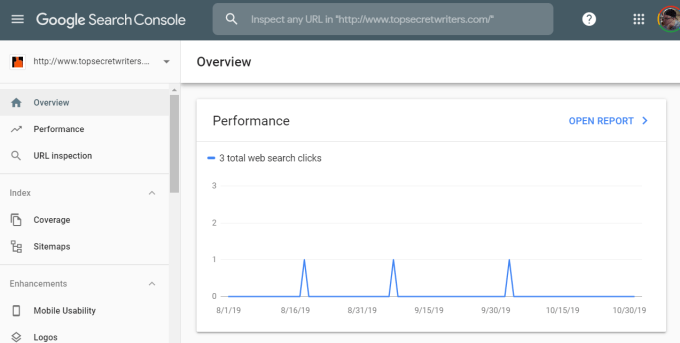
This will open a new series of charts that let you dig down deeper into Performance.
This page breaks down performance into a number of areas.
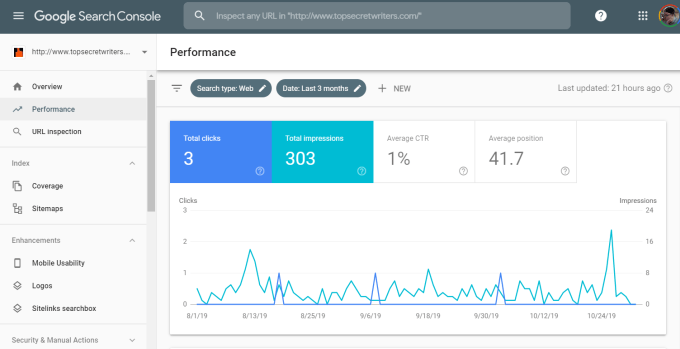
These areas include:
- Total number of times someone selected your link from search results
- Total number of times your site was listed in the top search results
- The average clickthrough-rate (views vs. clicks) for your site
- Your average search position in Google search results
As you scroll down the performance page, you’ll also see a list of the top search queries that are bringing people to your site via Google search.
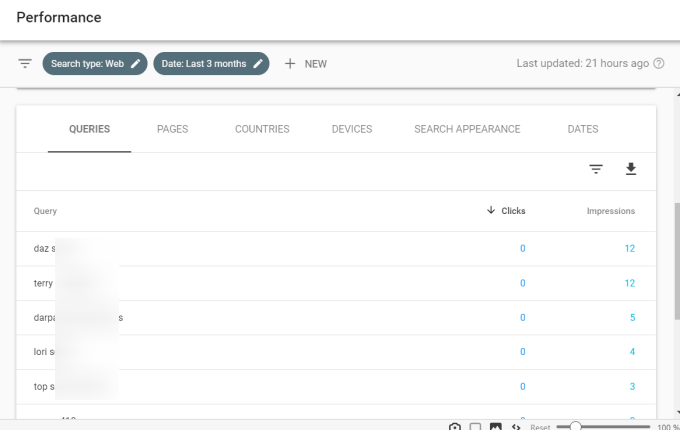
By selecting the tabs at the top of this section, you can also see:
- Top pages that are ranking for your site
- Top countries where most of your search visitors are coming from
- Top devices that most of your search visitors are using
- How your site appears in search results
- A daily breakdown of your pages impressions and clicks
You can modify the timeframe of any of this data and these charts for any time range up to 16 months in the past.
Site Coverage
The coverage of your website shows you how many pages are being crawled, and whether the crawler is experiencing any errors during its crawl of your site.
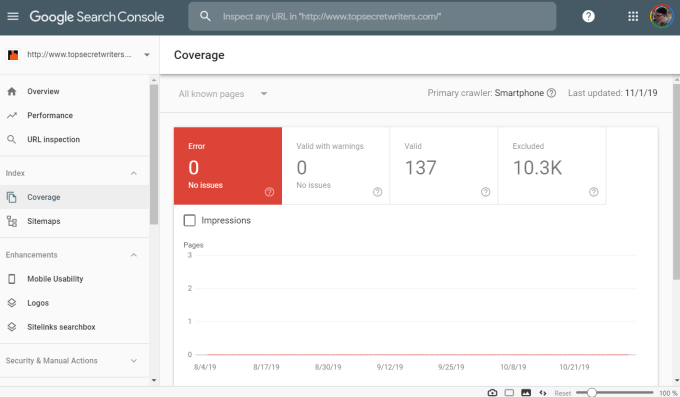
The list under this table will provide important error information if Google has excluded any of your site pages due to crawl errors.
If you see a situation like the one above, where the majority of your website is excluded and there are no errors, it’s likely due to a configuration mistake on your end.
This could be caused by any of the following:
- Your robots.txt file is blocking Google’s crawler
- Your .htaccess file contains a “noindex” blogging Google
- You’ve converted your site to https and haven’t updated Google Search Console with your updated domain
If any part of your site is excluded for any other reason, you’ll see those reasons in the error table and you can troubleshoot and fix the issue from there.
Other Google Search Console Information
Looking through the navigation bar on the left, there are a few other important areas you should know about.
Select URL inspection to see what the Google Crawler sees when it crawls a specific page on your site.
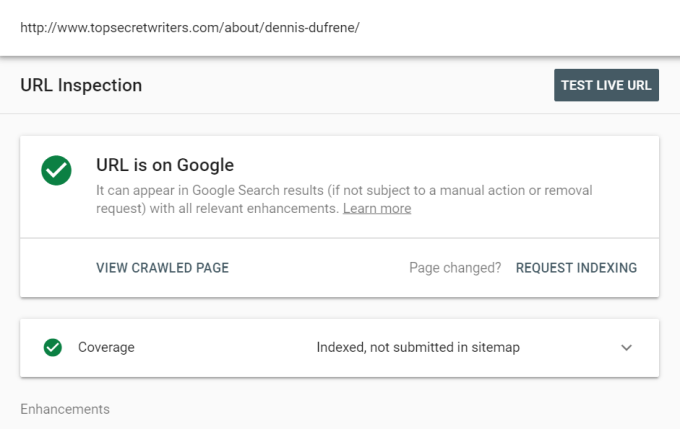
What you want to see is all green. It should report that the URL appears in Google Search results, and it should also give you more details about the indexing status and any crawl limitations.
This is a very useful way to check whether your most important site pages are getting indexed by Google, and to see any errors describing why they’re not.
Selecting Sitemaps from the navigation bar will show you whether you have a properly submitted sitemap and how many pages on your site the crawler recognized thanks to your sitemap.
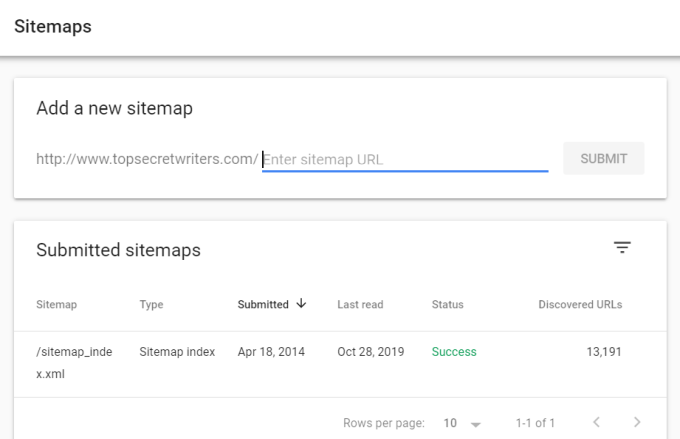
You’ll see the sitemap file that’s recognized by the Google crawler as your site’s sitemap XML file. It’ll show when you:
- Last submitted that sitemap to Google
- When the crawler last read from the sitemap
- The current status
- Total pages (URLs) listed in the sitemap
Hopefully, you’re using a good SEO plugin that’ll build your entire sitemap file for you.
Under the Enhancement area of the navigation menu, you’ll see some additional data to help you improve your site in search results.
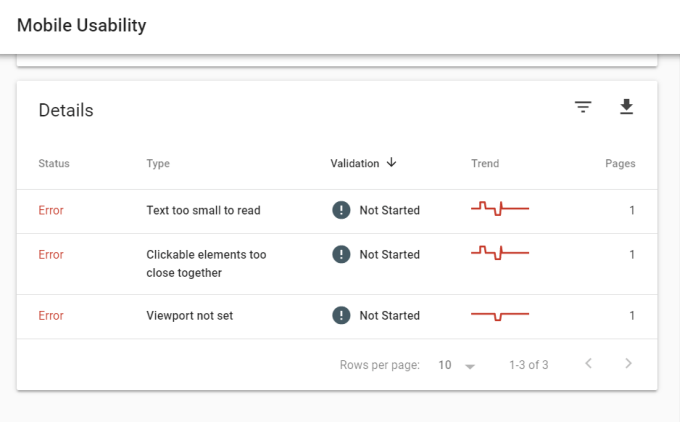
The first is Mobile Usability, with errors that’ll give you some insights as to why certain pages on your site aren’t mobile friendly.
The Logos page will include details about performance and errors caused by any of your Logo markup, if you use it. You’ll see details here that you can use to troubleshoot any problems.
The Sitelinks Searchbox page includes any performance or error issues caused by an Sitelinks Searchbox markup you may have on your page.
If you don’t see any information on the above two pages, it’s because you aren’t using that markup on your site.
Under the Security & Manual Actions section of the navigation pane, you can see whether Google has taken any actions against your site based on security or other issues. If everything is good with your site, you should see a green checkmark with “No issues detected” printed next to it.
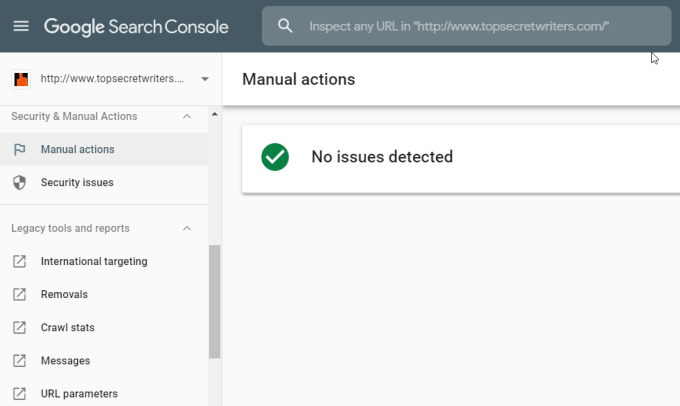
If there are issues, Google will display the error which should help you dig deeper into what’s causing Google to take action against your site and resolve those issues quickly.
The last page is a Links page which will give you insight into all of the following related to how other sites are linking to your site.
- Your top linked pages
- Other sites that link to your site the most
- The most common text phrases people use to link to your site
This information provides you some insight as to how people view your page and what topics you’re most considered an authority for.
Legacy Tools & Reports
For a limited time, you still have access to many of the tools and reports that were available in the legacy version of the Google Search Console – formerly known as Google Developer Tools.
These tools provide most of the same information listed above but in a different format and slightly different data. However, all of these tools will be retired soon, so it’s best to get used to using the Google Search Console and all of the tools provided there.
By understanding how to use the Google Search Console you’ll be able to make sure that your site’s Google Search health is strong, and that you have the best chances of getting listed high in Google search results.
Related Posts
Ryan has been writing how-to and other technology-based articles online since 2007. He has a BSc degree in Electrical Engineering and he’s worked 13 years in automation engineering, 5 years in IT, and now is an Apps Engineer. Read Ryan’s Full Bio
