Do you often use Task Manager on your Windows 10 PC to keep track of the different processes on your system and how much CPU or memory they’re using? If so, you might find that you prefer two alternative options – Process Monitor or Process Explorer.
Both are free tools that you can install on your Windows 10 PC. They include the same information you can see in Windows Task Manager and a whole lot more as well.
What Is Process Monitor?
Process Monitor is a free advanced monitoring tool included in the Windows Sysinternals suite of Windows utilities. It lets you view detailed information about all processes running on your system.
Specifically, these are details about events triggered by specific processes.
The following process information fields are selected by default when you first launch the app.
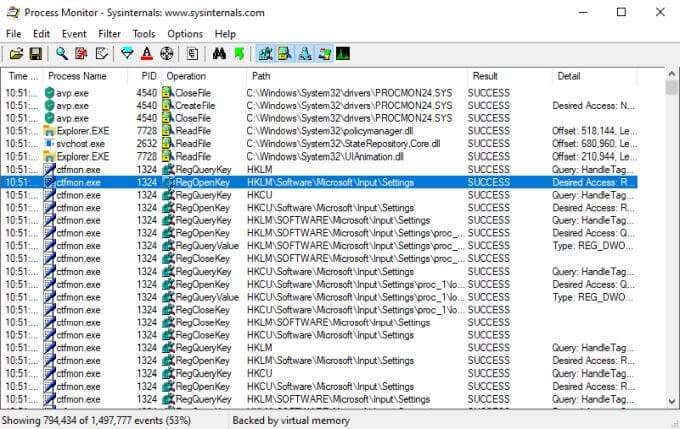
- Process Name
- Path
- Detail
- Result
- Operation
- Time of Day
- Process ID (PID)
There are 20 additional fields you can select to see even more information about each process.
You aren’t limited to just view process information with this tool. You can also set filters on any field to limit what data gets displayed, log process events for troubleshooting, and a process tree that lets you see the relationship between parent and child processes.
What Is Process Explorer?
Process Explorer is the best tool for understanding how different applications are working on your system. Through an innovative tree structure, it’ll show you a breakdown of what files, directories, and other processes each parent process is controlling.
You can use Process Explorer in “handle mode”, which helps you see what window handles each process has opened, or “DLL mode”, which shows you DLLs and memory mapped files each process has opened.
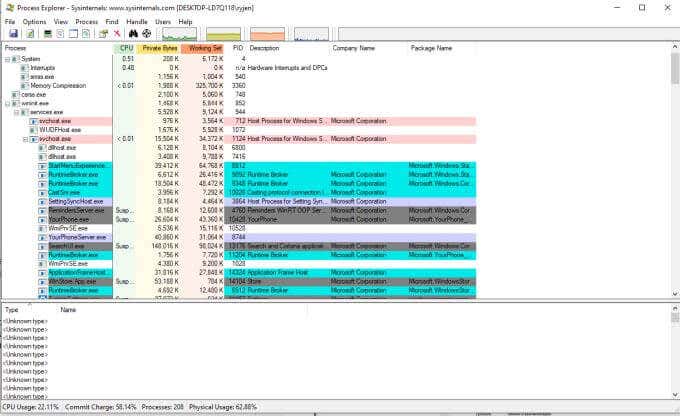
This makes Process Explorer extremely useful when troubleshooting or debugging applications that are running on your computer.
Now that you know what each of these free SysInternals utilities is used for, let’s take a closer look at how you can use each of these on your own Windows 10 PC.
How to Use Process Monitor
After you extract the Process Monitor files you’ll see different files to launch the utility. If you’re running a 64-bit Windows system, choose the file named Procmon64.exe. If not, then choose the Procmon.exe file.

From the main Process Monitor window, you can launch a view that’s similar to the Process Explorer app. This is the process tree view. To view this, just select the small document icon with an image of a tree diagram on it.
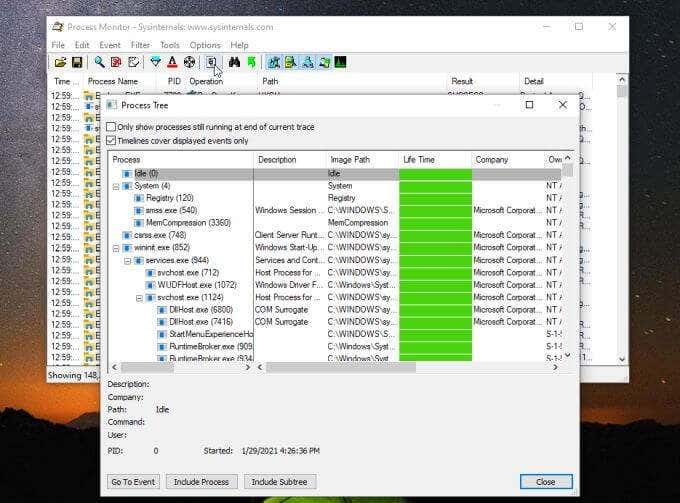
Some information you can see in this view includes the parent process and all of the processes it has launched. You can see its launch command, the app developer (if available), how long it’s been running, and the date it was launched.
It’s not as informative as Process Explorer, but it’s a nice quick view to see much of the same information.
Create a Process Monitor Filter
Back on the main screen (process events window), right click any of the processes and choose Edit Filter to update the process filter.
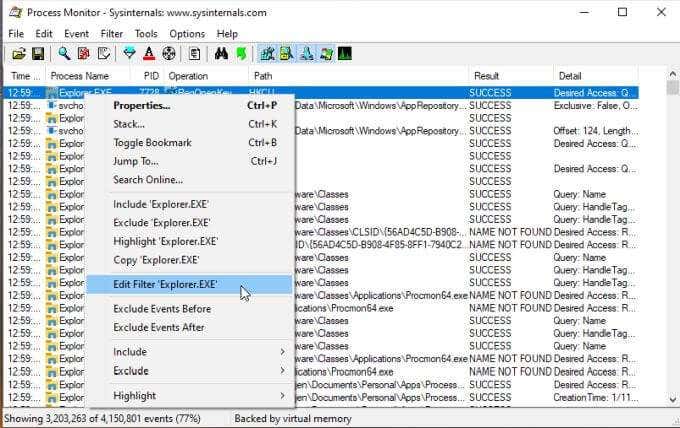
This window shows you how filtering works in Process Monitor. The first dropdown lets you select the object for your filter. In this case it’s the Process Name. The next dropdown is the operator like is, is not, less than, etc. The field is where you can type or select your filter, and whether you want to Include or Exclude those entries.
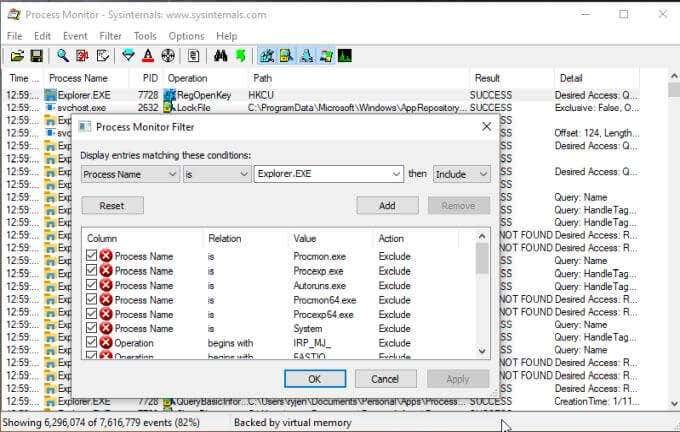
When you select Add, it’ll add that new filter to your list, and modify the overall view of processes accordingly.
To create a new filter, select the Filter menu, and select Filter.
This will open the same window but with the filter blank. Just select each dropdown, enter the filter item you want to exclude or include, and add it to your filter list.
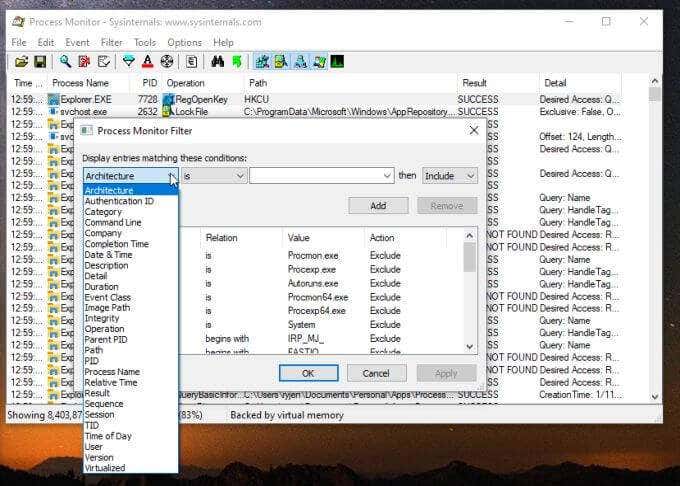
Once you select OK it’ll update your main view to include your new filter.
The most useful feature of Process Monitor is logging system events during some action. You can log system events as follows:
- Press the magnifying glass Capture icon to stop logging.
- Select the eraser on paper Clear icon to clear the log.
- Press the Capture icon again to start logging.
- Select Filter and Enable Advanced Output.
- Recreate the issue.
- Select the Capture icon again to stop logging.
- Select the disk Save icon to save the log to your computer.
You can review the log to see all process events that occurred when you recreated the issue or error you’re trying to troubleshoot.
Exploring Deeper with Events
When you select specific events in Process Monitor, you can explore more details through the Event menu.
Select the event you want to examine. Then select the Event menu and select Properties.
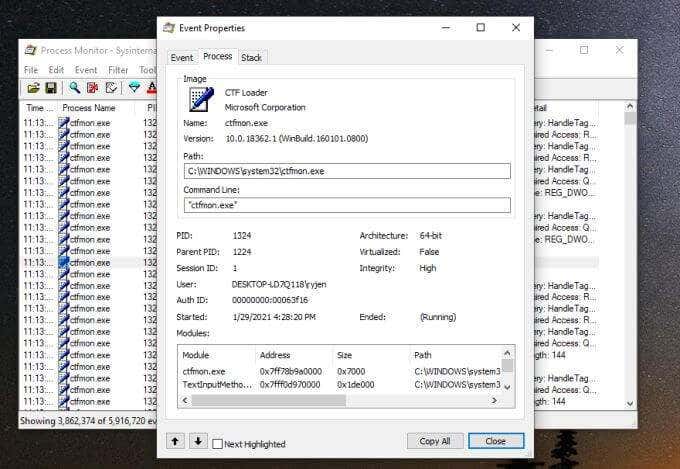
This shows all properties for the event. The Event tab shows mostly what was in the main Process Monitor window. The Process tab shows you things like the path to the application and the launch command line, as well as modules used by the process. The Stack tab provides modules stored in memory by the process and their details.
You can access just the Stack tab by selecting Stack in the Events menu instead.
If you want to keep a close eye on any single events, select it and then select the Event menu and select Toggle Bookmark.
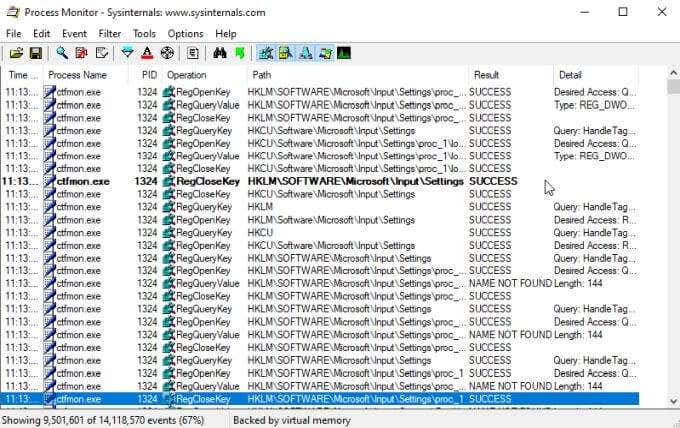
This will highlight the event so it’s easier to track.
You can also see the Registry entries for any process by selecting the Event menu and selecting Jump To.
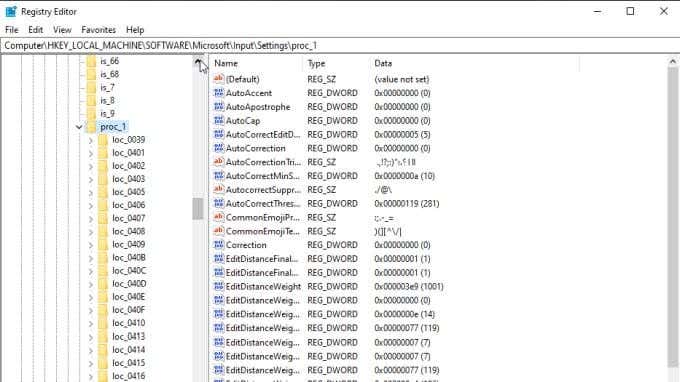
This is a quick way to see any registry entries you may want to toggle to configure that application.
You’ll see five icons to the right side of the toolbar that you can use to fine-tune the default filters.
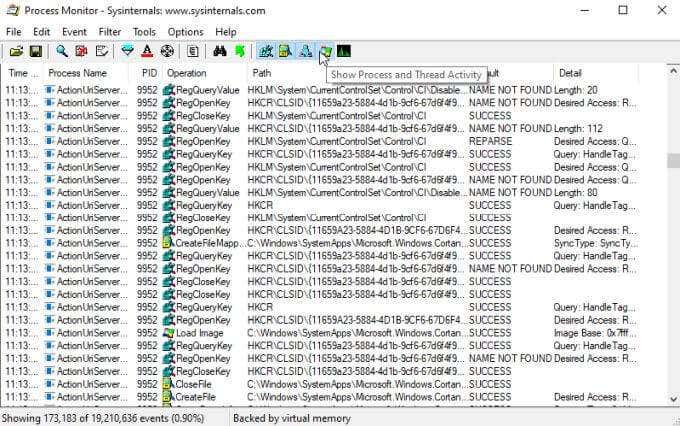
You can use these to turn on or off each of the following filters:
- Registry activity
- File system activity
- Network activity
- Process and thread activity
- Profiling events
How to Use Process Explorer
Use the same approach for 32-bit or 64-bit when you launch Process Explorer.

The View menu is where you can customize what process information gets displayed in each pane.
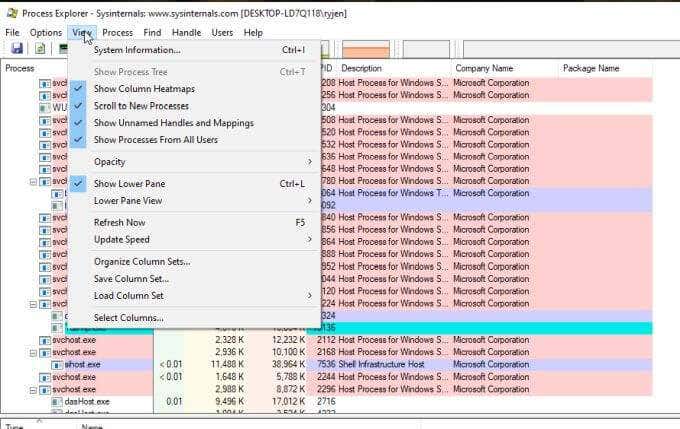
Use Lower Pane View to change the data displayed there from Handles to DLLs.
The most important menu here is Process. The following is what each menu option will show you and let you control.
Set Affinity shows which CPUs the selected process can execute on. You can enable or disable any of the processors if you like.
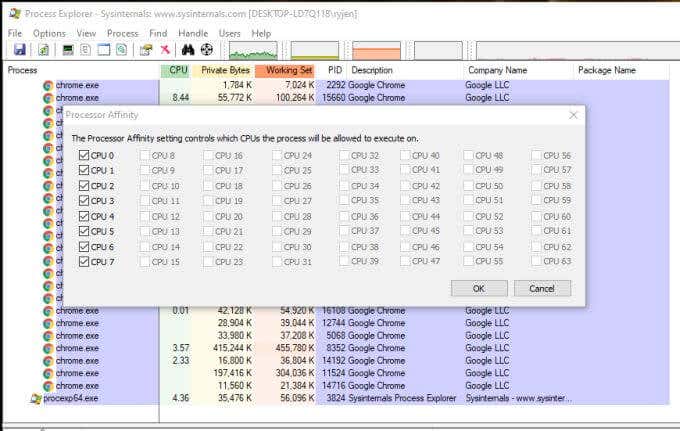
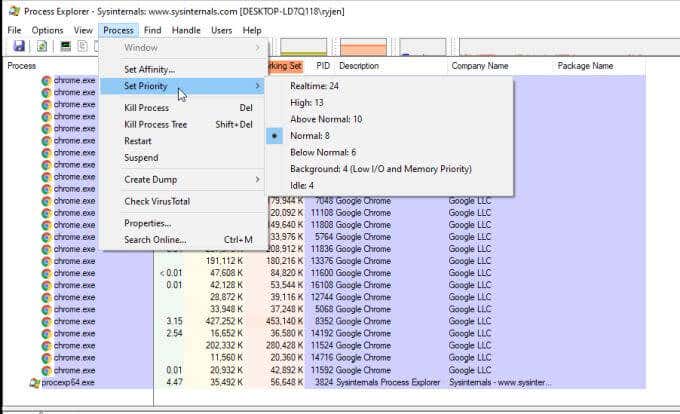
Set Priority lets you increase or discrete the priority that the CPU gives that process. This is a good way to troubleshoot lagging or slow-running applications to see if it’s an issue with too many other processes running.
The next four options let you control each process.
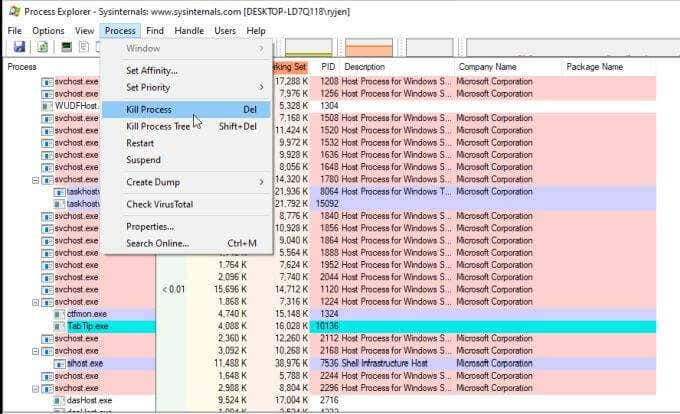
These include:
- Kill Process: Force stop an individual process
- Kill Process Tree: Force stop the process and all child processes
- Restart: Stop and start the selected process
- Suspend: Suspect the selected process
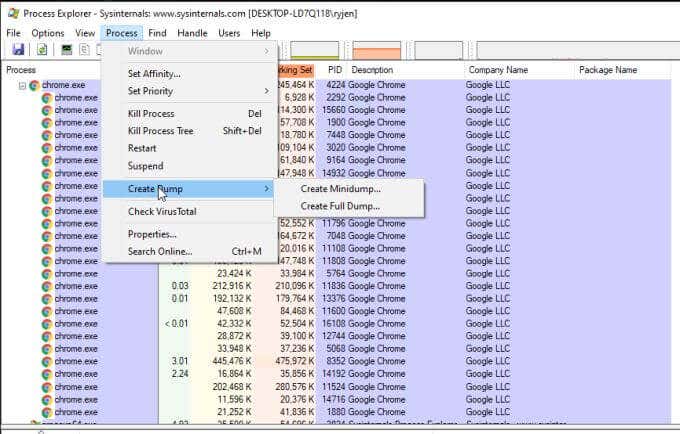
You can create dump or minidump files associated with the selected process by selecting the Process menu and selecting Create Dump. Then choose whether you want a Minidump or a Full Dump.
If you select Check VirusTotal in the Process menu, Process Explorer will submit hashes for the files associated with the process and DLLs to VirusTotal.com. VirusTotal will scan and analyze those for any virus activity. You will need to agree to VirusTotal’s terms of service before you can use this feature.
Finally, if you select Properties from the Process menu, you can view a wide variety of properties about the selected process.
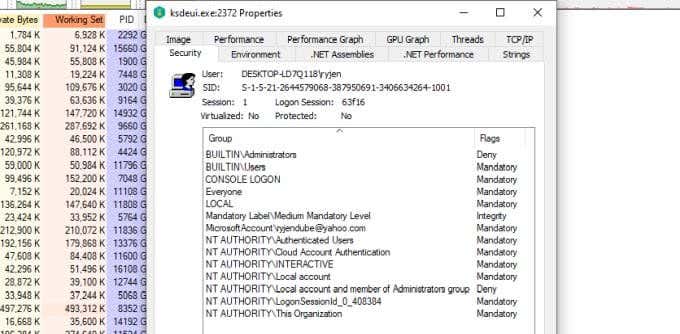
This includes information related to performance, GPU use, total threads, network activity, and much more.
Should You Use Process Monitor or Process Explorer?
While these two utilities are similar, they aren’t the same. Process Monitor is better used if you need to track how your processes are interacting with your system. It lets you monitor and log events that are triggered by each process.
It can help you see whether the interaction between your processes and your system is causing errors or behaving abnormally.
Process Explorer, on the other hand, is heavily process focused. It helps you see the relationships between parent processes and its child processes. It also lets you dig much more deeply into parameters and properties of each process, far more than any other available Windows utility.
Choose the utility you want depending on what you’re specifically troubleshooting.

