Your computer has lots of components and software that, over time, can become negatively affected by use, software bugs, outdated drivers, and more. That’s why it’s smart to regularly monitor and attend to your computer’s overall health.
In this article, you’ll learn about the various utilities offered by Windows to create computer health reports. We’ll also include ways to fix the most common issues that these reports turn up.
Use the PC Health Check Tool
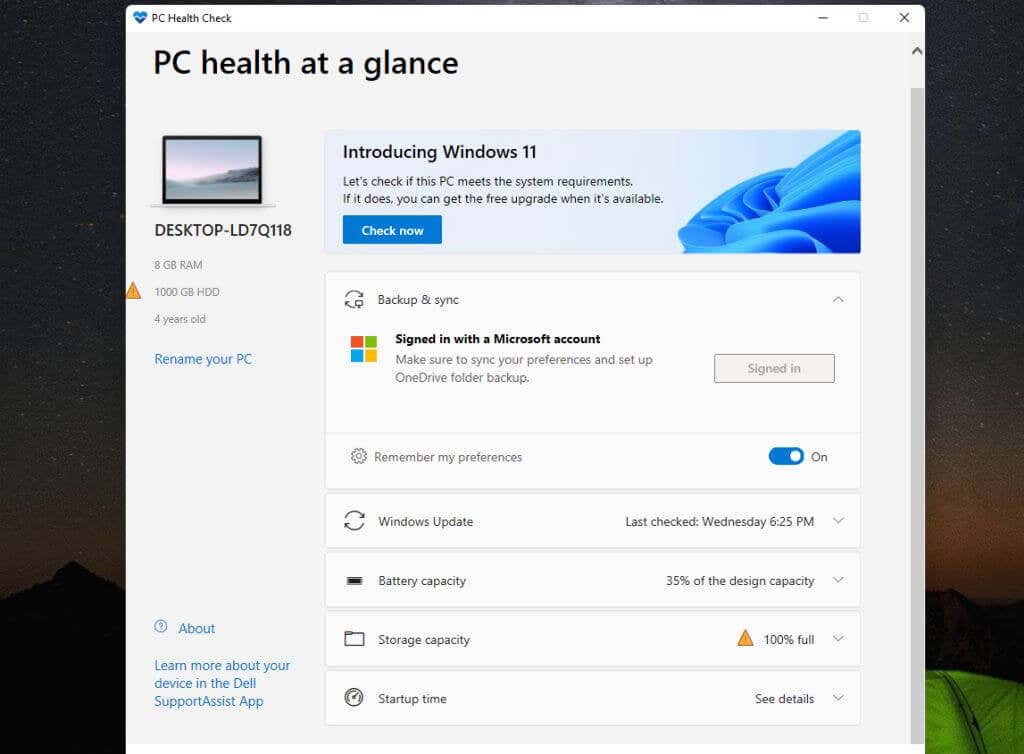
Windows 11 comes with a built-in tool called PC Health Check that provides information such as whether your OS is fully updated, how much storage your computer has available, your laptop’s battery life, and common issues affecting startup time.
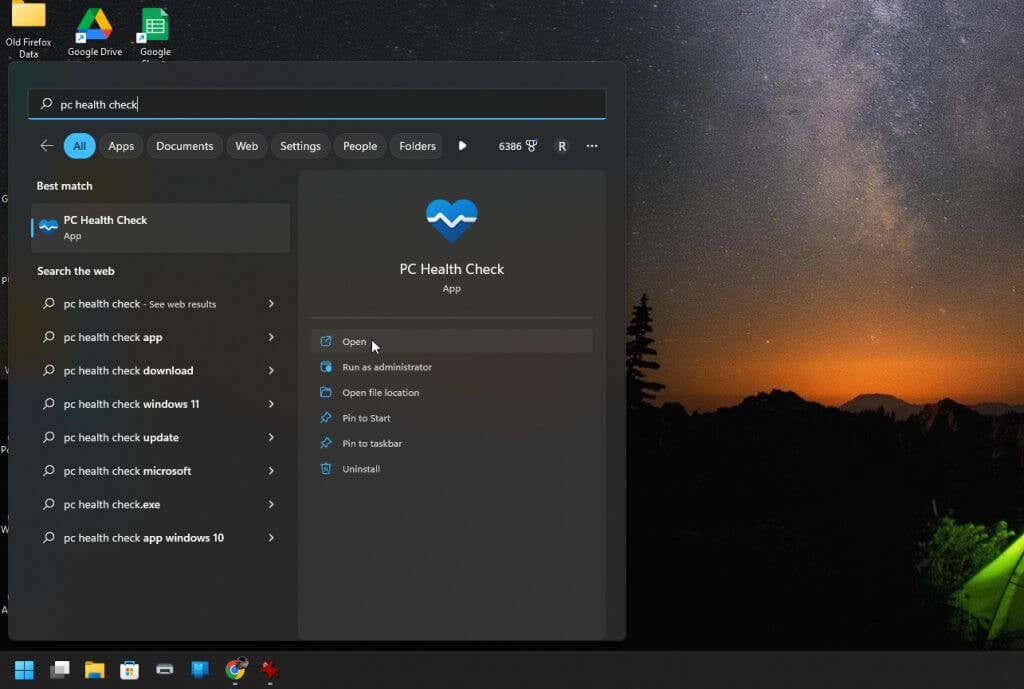
To see if PC Health Check is already installed on your system, select the Start menu and type “PC Health Check”. Select Open to open the app.
This will either open the PC Health Check app, or it’ll automatically download and install the app for you.
Once it launches, you’ll see each major system check in its own box in the right pane. If there are critical issues, you’ll see a question mark inside a triangle as a warning icon in that box.
PC Health Check even shows you how much your battery capacity has degraded over time. This can be a good indicator when you need to replace your battery (or else always keep your laptop plugged in).
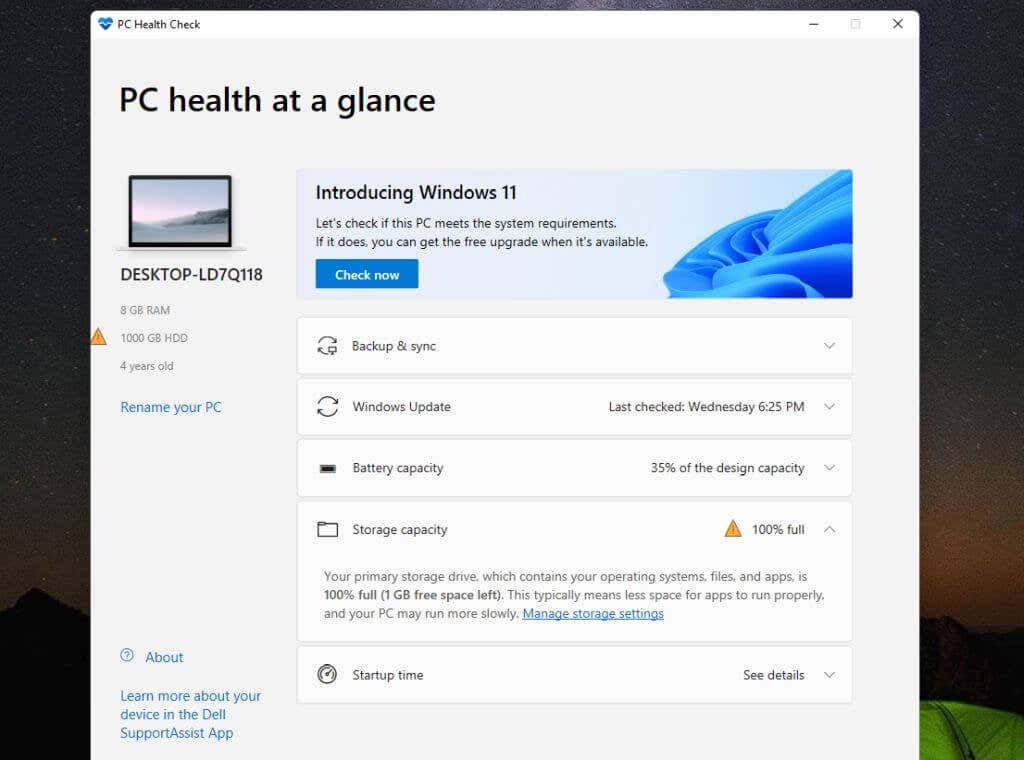
You can use the dropdown icon at the right side of each box to see suggestions and tips for resolving or improving the issue.
For example, if your storage capacity is low, you’ll see a link to go directly to the Windows utility for managing your storage settings.
Check PC Health with Windows Security
Windows Security is another Windows utility that will give you a good snapshot of your PC’s health. It provides much of the information that PC Health Check does, but also more.
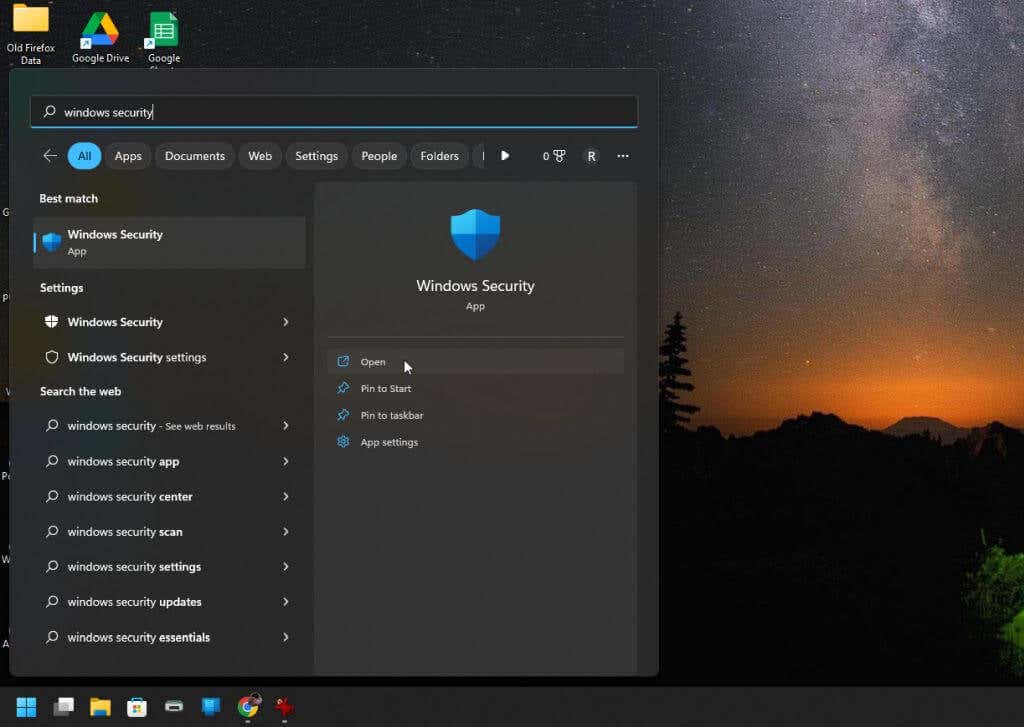
To launch Window Security, select the Windows Start menu and type “Windows Security”. Then, select Open to open the app.
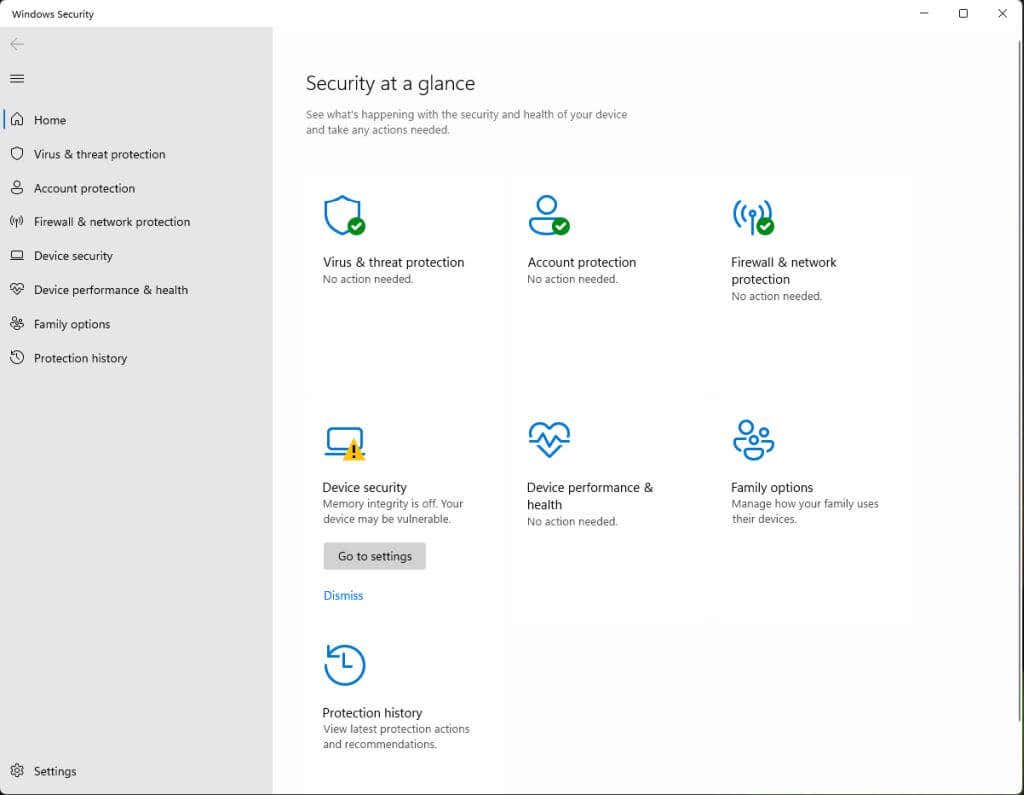
When the app opens, you’ll see a health report highlighting areas that don’t have issues with a green checkmark, and areas that have issues with an exclamation mark inside a triangle.
This app looks for issues such as:
- Critically low storage capacity
- Issues with your Windows account
- Firewall or network problems
- Security issues with system devices like memory
- Overall system performance
- Microsoft family account management
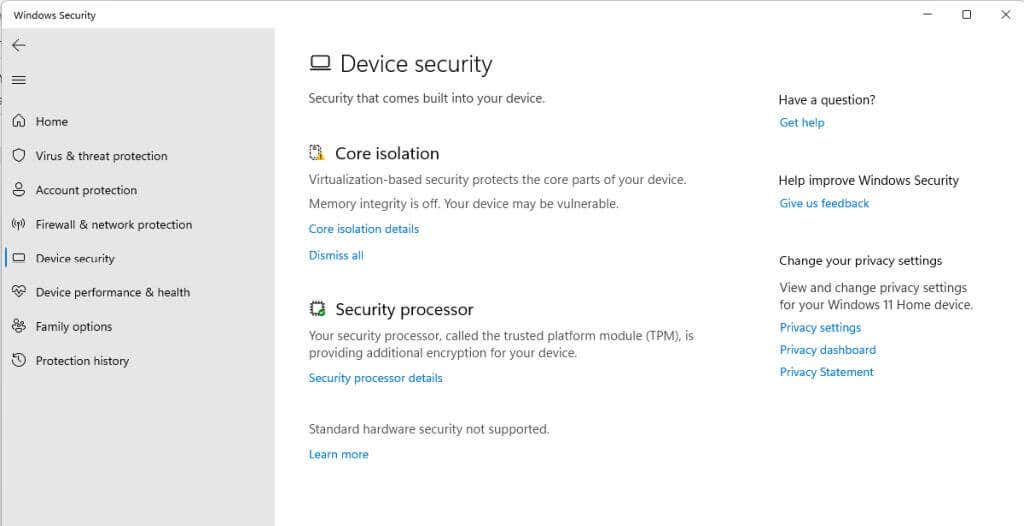
You can select any of the areas that have issues to see tips and links to tools that’ll show you more details for troubleshooting purposes. On the main screen you may also see a link to access the appropriate Windows settings tool as well.
You can also select any of the items with a green checkmark to see more details.
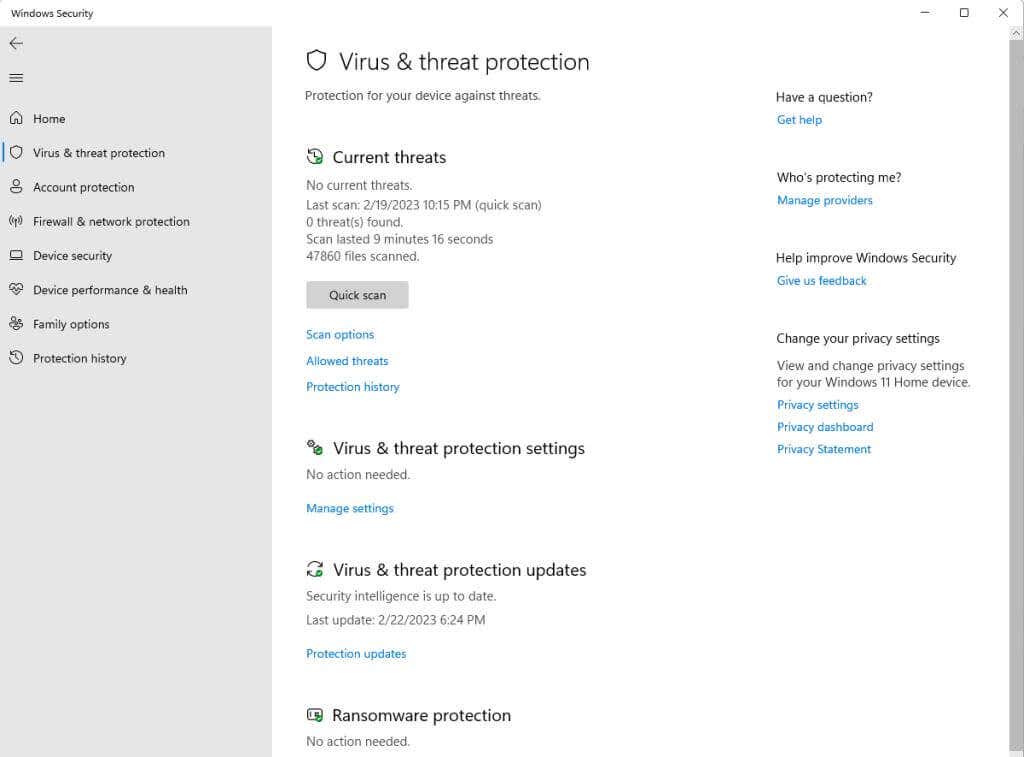
For example, if you select Virus & threat protection, you’ll see a page that shows you the last scan and how long the scan took. You’ll also see the scan status for things like viruses and ransomware.
Keep in mind that a green checkmark doesn’t mean all items inside that area are fully okay. It just means that most issues are okay, and there are no critical issues that you need to be concerned about. However, you may see minor issues and tips on how to resolve them.
Check PC Health with Performance Monitor
Performance Monitor has been a diagnostic tool available on Windows PCs for quite some time. Unfortunately, not a lot of people know how to use it.
Thankfully, checking Performance Monitor for PC health issues is fairly easy, since it comes with built-in reports that will give you information about the health of your system disk, memory, devices and more.
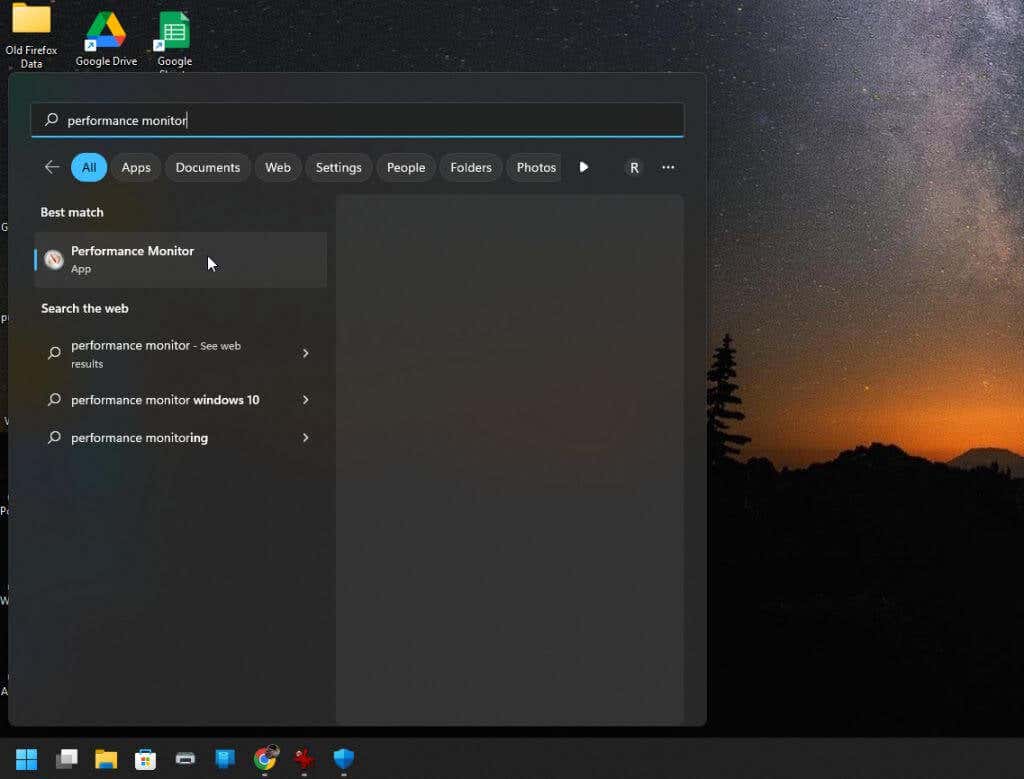
To launch Performance Monitor, select the Windows Start menu and type “Performance Monitor”. Then, select Performance Monitor App to open the app.
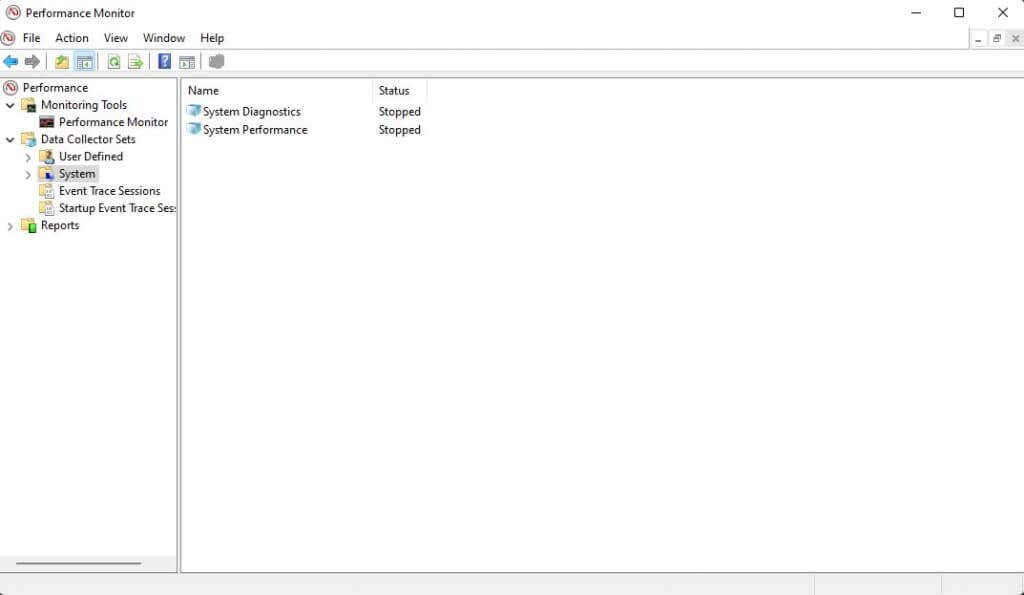
The two reports that are available for system health are System Diagnostics and System Performance. You’ll need to generate each report in the Performance Monitor to see your PC health details.
- Select Data Collector Sets in the left pane, and then select System.
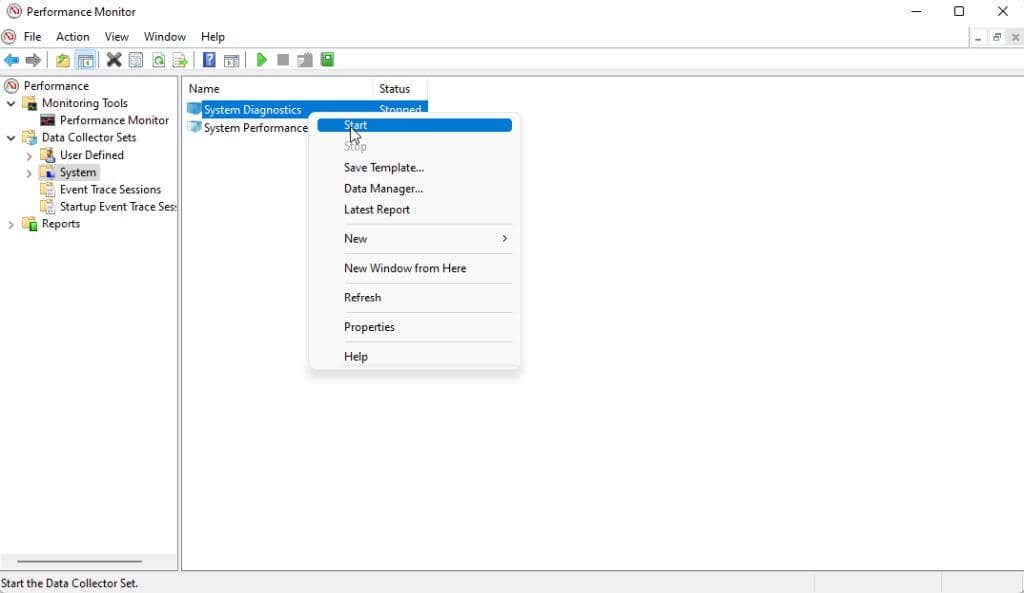
- Right-click System Diagnostics and select Start. Repeat this for System Performance as well.
Wait about a minute or two for both reports to generate. When they’re ready, you can access them in the Reports section of the Performance Monitor.
Note: When the status of each report in the right pane is “Stopped” again, the reports are ready.
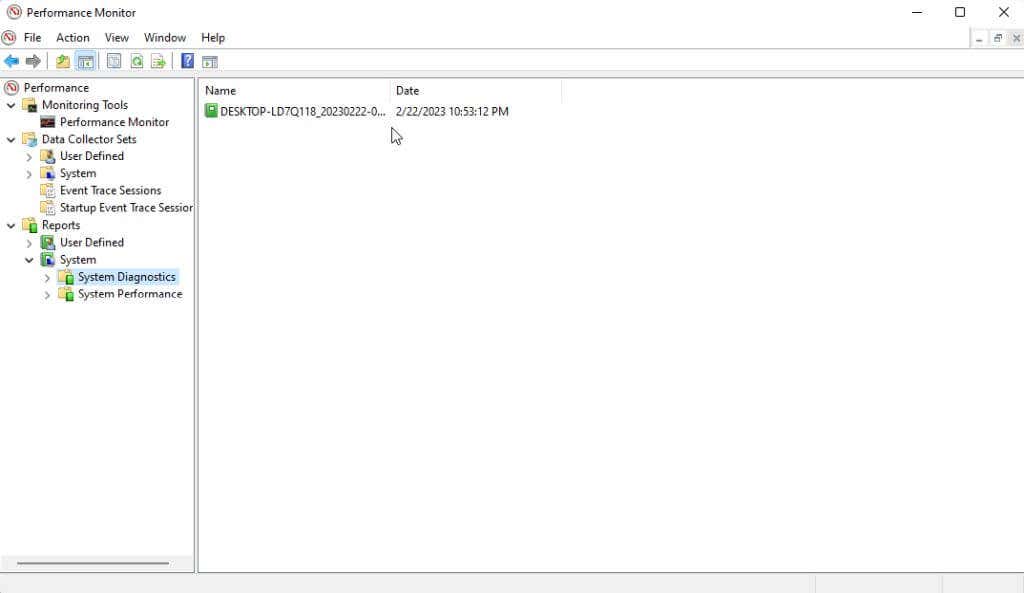
Select Reports from the left menu and select System. Select one of the reports, and then double-click the report title (typically contains your computer name in the title).
When the report opens, you’ll see a great deal of details. The easiest to analyze are the Basic System Checks and Resource Overview in the System Diagnostics report. That’s because those have indicator lights highlighting any issues.
The rest of the information throughout both reports do require an advanced level of understanding about system analytics. You can learn more about how to do this in our article about using performance monitor to improve system performance.
Use a Sleep Study to Check Battery Health
For any laptop that features a sleep state feature, Windows provides a command-line utility you can use to analyze the current health of your installed battery.
The health report includes information about all devices that use battery power, and their energy consumption patterns. It also reveals how many times your current battery has gone from fully discharged (dead) to fully charged. These are known as battery cycles.
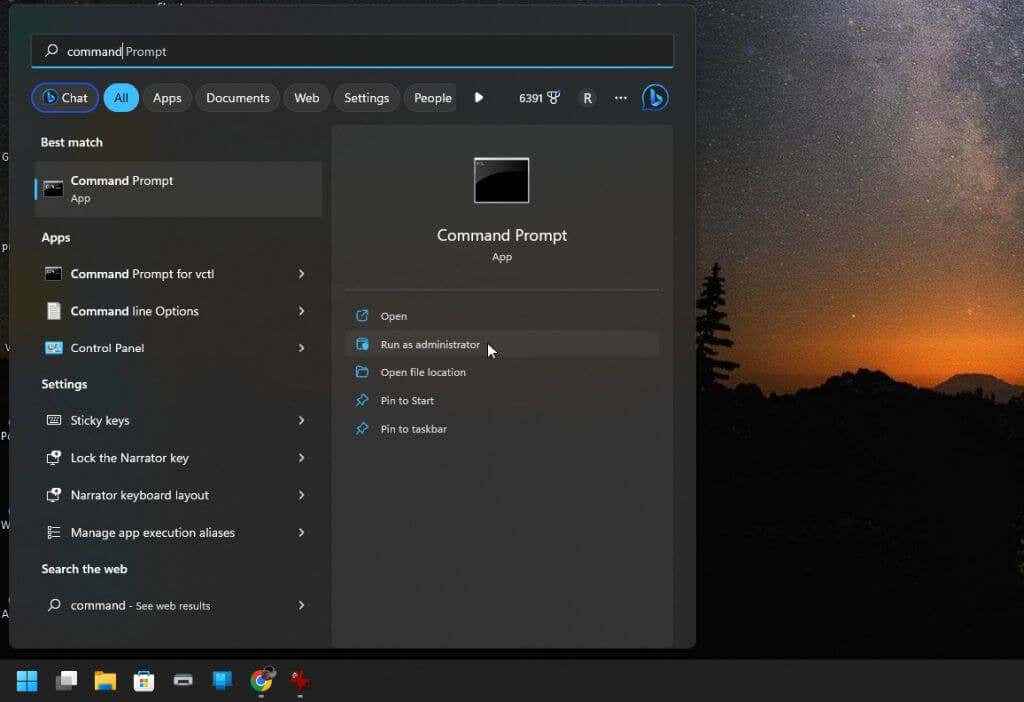
1. Open the elevated Command Prompt by pressing Start and typing “Command Prompt” in the search field. In the Command Prompt window, select Run as administrator.
2. To use the utility, type the following into the command prompt window:
Powercfg /SleepStudy /output %USERPROFILE%\Desktop\fullsleepstudy.html
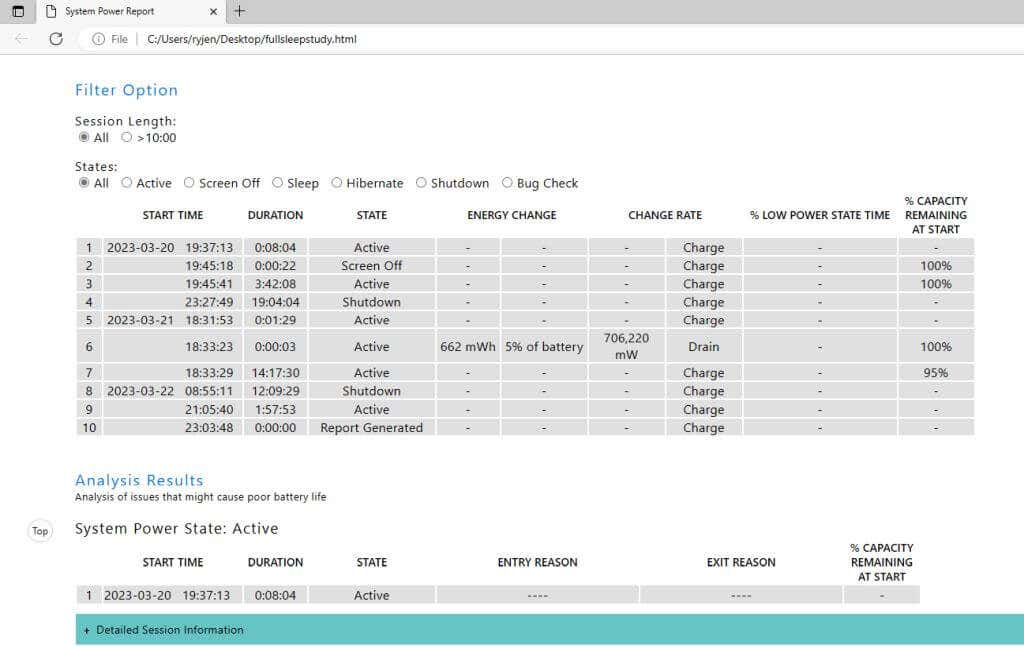
Wait about 30 seconds and this will output a file called “fullsleepstudy.html” onto your desktop. Just double-click the file to open it using your default web browser.
This report will show a chart with the history of battery drain and recharge, session information with battery usage time, and the top devices or apps that drain the most battery power.
Depending on how you’ve used your computer, these top battery users may not come as a surprise.
The default report provides three days worth of battery usage history. To extend this, just add the “/duration” parameter after the command:
Powercfg /SleepStudy /output %USERPROFILE%\Desktop\fullsleepstudy.html /duration DAYS
Replace “DAYS” with any numeric value up to a maximum of 28.
Checking Your Computer’s Health
All of the tools listed above are ideal for those situations where your computer or certain components of your computer are behaving oddly. The reports or information available in these tools will provide you with the clues you need to track down the source of the problem.
If you’re experiencing hard drive issues specifically, make sure to check out our full guide on checking and fixing hard drive issues.
Related Posts
- How To Fix GeForce Experience Error Code 0x0003 on Windows 11?
- How to Stop Laptop Battery Drain: 10 Pro Tips to Save Your Power
- How to Enable Troubleshooting Mode in Windows 11?
- How to Speed Up Windows 11 Slow Boot Times
- Sluggish Windows 11 PC? Try These 5 Windows 11 Tricks to Free up Virtual Memory
Ryan has been writing how-to and other technology-based articles online since 2007. He has a BSc degree in Electrical Engineering and he’s worked 13 years in automation engineering, 5 years in IT, and now is an Apps Engineer. Read Ryan’s Full Bio
